

Employee engagement driver benchmarks 2026: CultureMonkey’s data-backed analysis
Employee engagement driver benchmarks measure how specific workplace factors influence engagement growth across organizations. CultureMonkey’s analysis of anonymized employee survey responses shows that leadership, involvement, meaningful work, and manager support consistently generate the strongest engagement improvement across industries.
The best employee engagement survey tools do not simply measure engagement. They help organizations prioritize the drivers that actually move engagement over time.
The CultureMonkey engagement driver benchmark:
This report introduces the CultureMonkey engagement driver benchmark, a longitudinal analysis of more than 10 million anonymized employee survey responses across industries, company sizes, and regions.
Why this employee engagement benchmark Matters in 2026
Employee engagement survey technology has evolved rapidly over the past decade, introducing real-time dashboards, AI-generated insights, continuous pulse surveys, and predictive engagement analytics. Organizations today have access to real-time dashboards, AI-generated insights, continuous pulse surveys, advanced benchmarking tools, and predictive engagement analytics.
Yet despite this technological evolution, sustained engagement growth remains inconsistent across industries.
The issue is not measurement. It is prioritization.
Most engagement strategies focus on visible initiatives, recognition programs, wellness campaigns, communication upgrades while overlooking the structural drivers that actually influence engagement over time.
“The best employee engagement survey vendors don’t just measure engagement — they help organizations prioritize the drivers that actually move it.”
To separate signals from noise, CultureMonkey analyzed more than 10 million anonymized employee survey responses across industries, company sizes, and regions. Rather than focusing on static engagement scores, this benchmark examines overall driver growth percentages across multiple survey cycles.
This is a movement analysis.
And the findings reveal a consistent pattern:
- Engagement growth is structurally concentrated.
- Only a small cluster of drivers consistently produces disproportionate lift.
Understanding this concentration is critical, particularly when evaluating employee engagement survey providers in 2026.
This benchmark report answers the questions executive teams are asking:
- Which engagement drivers generate measurable growth?
- Which drivers plateau despite investment?
- What differentiates high-growth organizations?
- How should organizations evaluate employee survey vendors using data, not features?
Executive findings
- Engagement growth is structurally concentrated; only 4–5 drivers produce disproportionate lift.
- Involvement (+1.51%) and Leadership (+1.50%) are the highest-growth structural multipliers.
- Recognition (-0.09%) and Wellness (-0.74%) show stagnation or decline in overall growth impact.
- Engagement behaves as a leadership system variable, not a perks variable.
Engagement growth benchmarks
This report summarizes overall driver growth benchmarks across industries based on CultureMonkey’s longitudinal analysis of more than 10 million anonymized survey responses.
The Intent
To help executive teams:
- Interpret which engagement drivers create measurable growth
- Understand leverage vs. noise
- Make informed decisions when evaluating employee engagement survey vendors
CultureMonkey benchmark insight
Across CultureMonkey’s 10M+ response benchmark dataset, engagement growth is unevenly distributed.
The gap between the highest-growth driver (Involvement +1.51%) and the lowest (Wellness -0.74%) is 2.25 percentage points
This variance is material. It signals structural leverage, not marginal difference.
Overall driver growth benchmark (All industries)
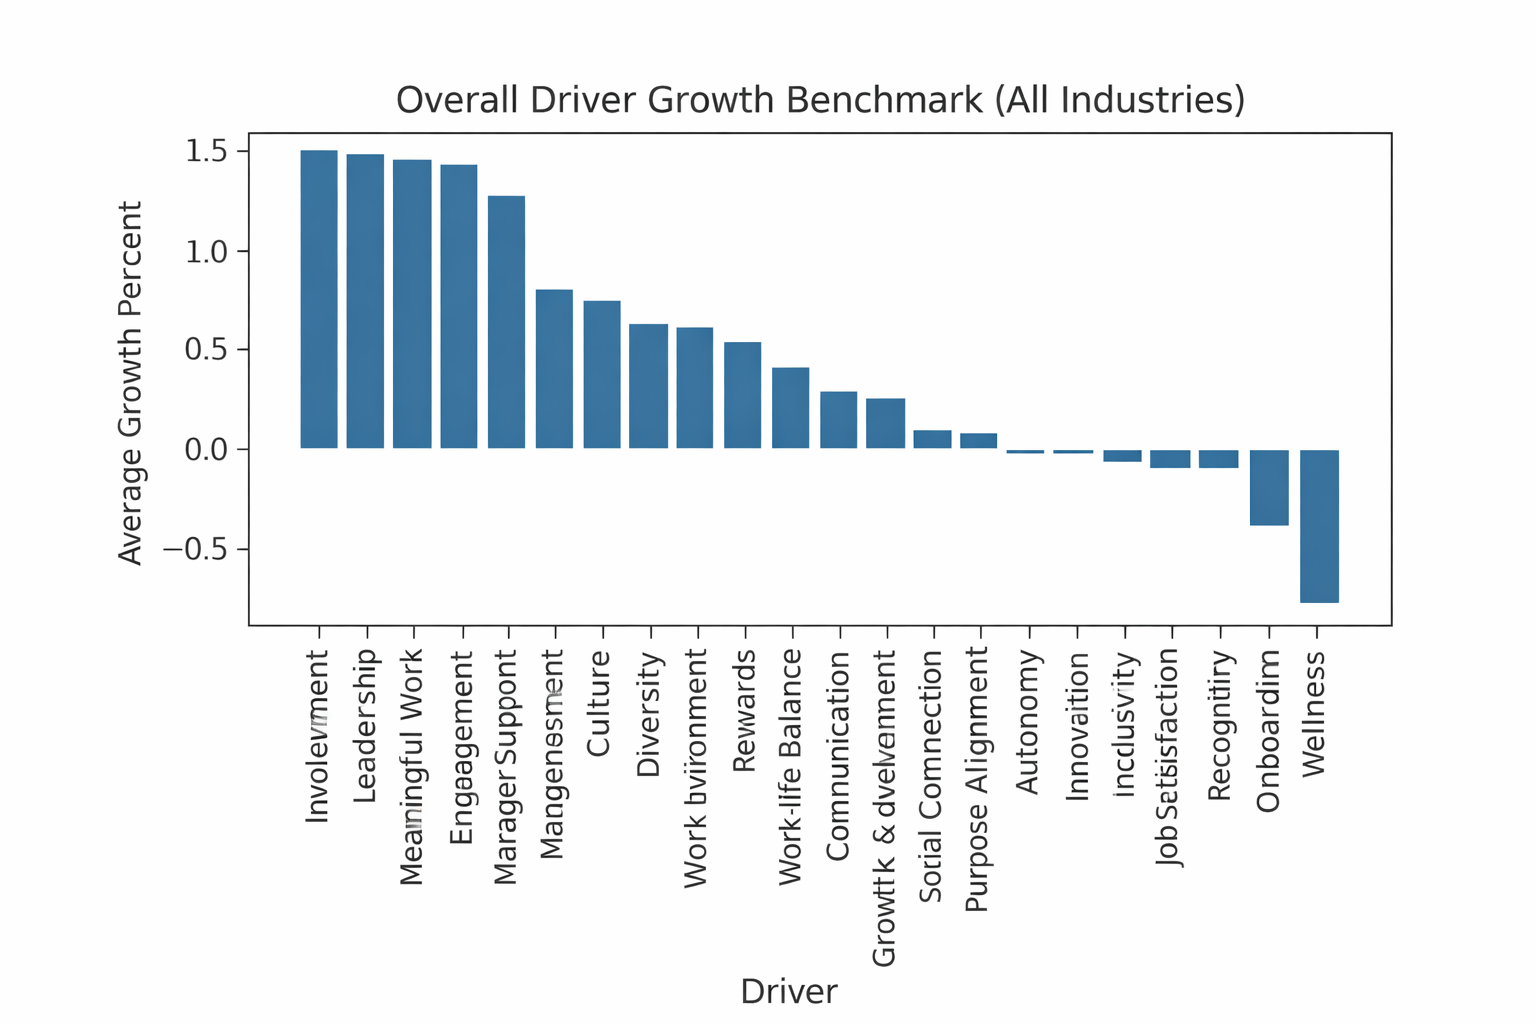
Driver growth ranking
To identify the highest-leverage drivers, CultureMonkey ranked drivers by average growth percent across organizations showing engagement improvement within its benchmark dataset.
Structural multipliers (Top Growth Drivers)
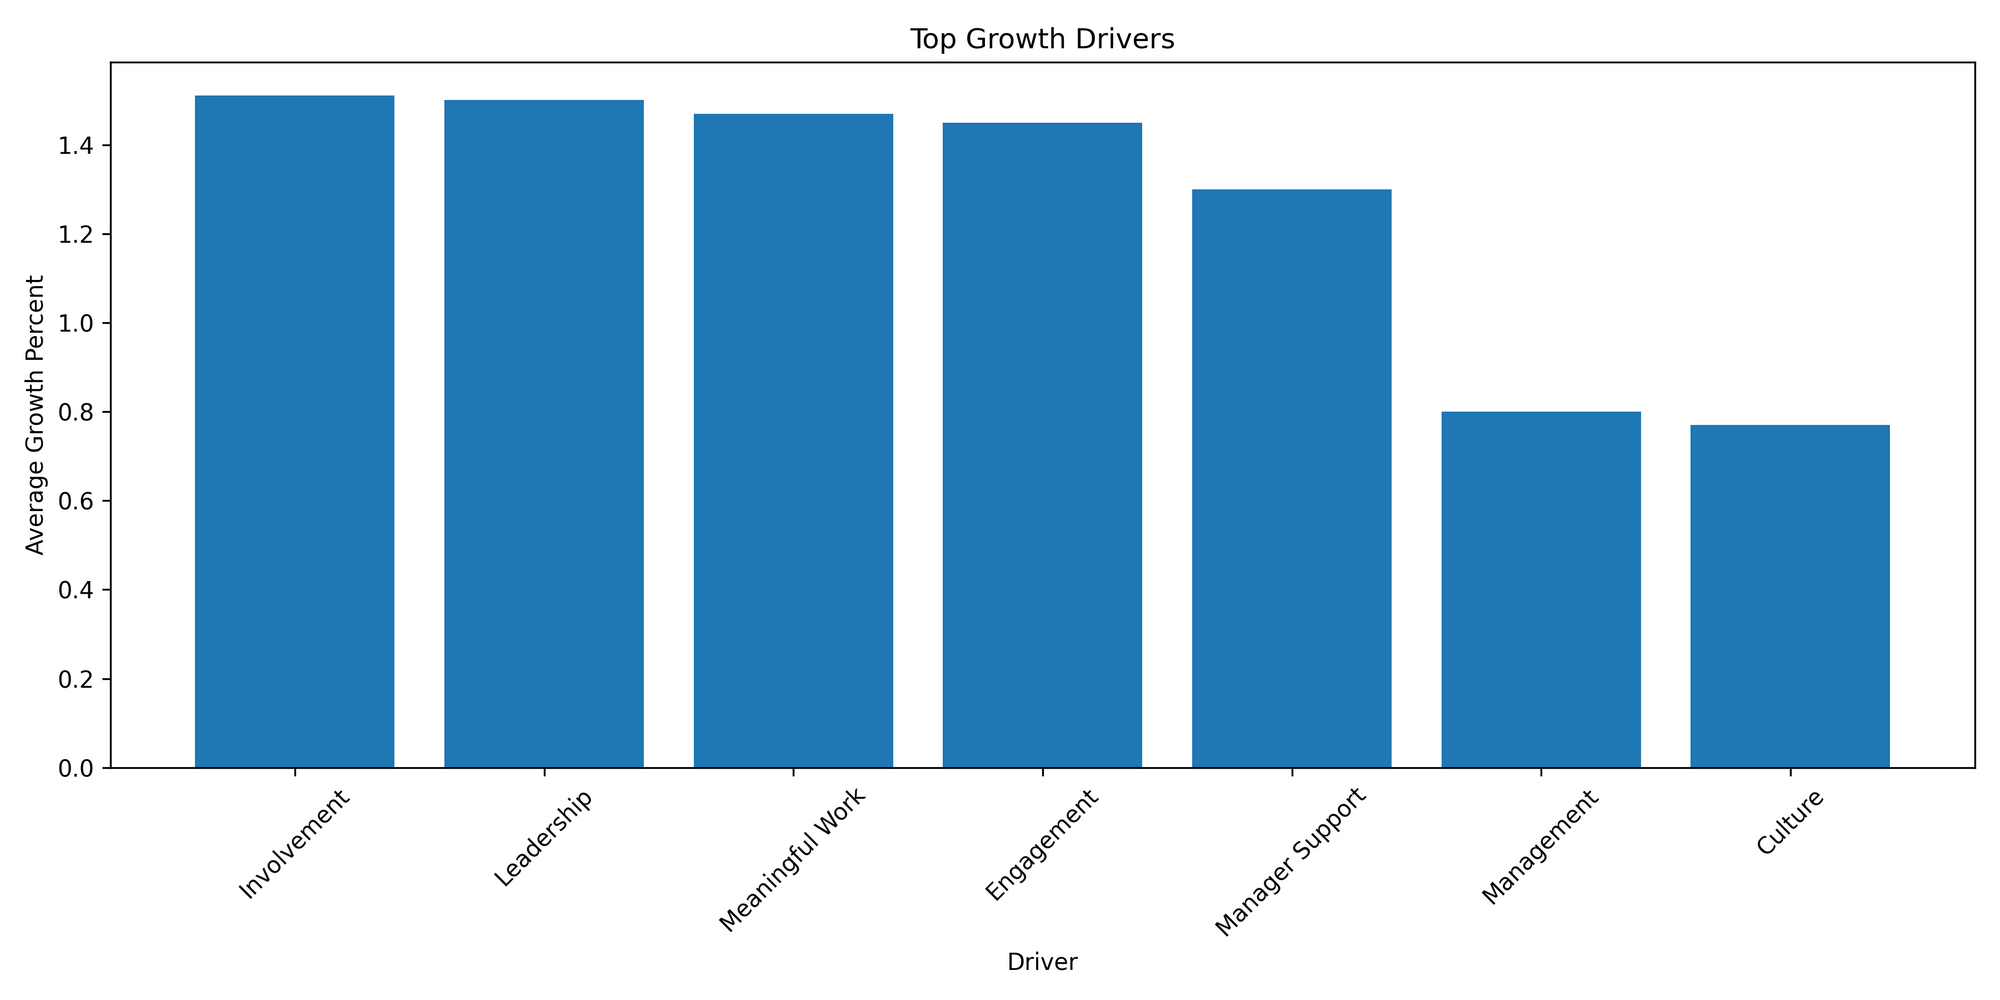
These drivers consistently differentiate high-growth organizations.
They reflect structural systems:
- Decision transparency
- Leadership clarity
- Manager enablement
- Employee voice
Optimization drivers
Within CultureMonkey’s longitudinal benchmark dataset, these drivers show positive but moderate growth.
These drivers enhance engagement, but rarely act as primary multipliers without structural alignment.
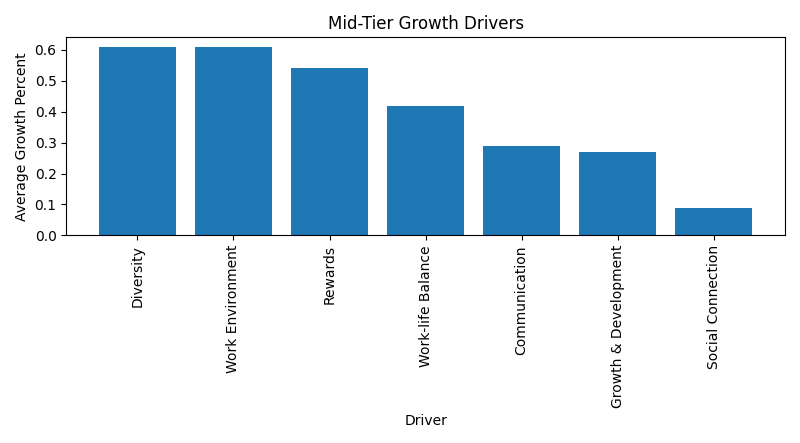
Strategic interpretation
These drivers enhance engagement. However, they rarely act as primary multipliers without structural alignment. Organizations focusing primarily on these areas without strengthening leadership and involvement tend to plateau.
Friction signals
In CultureMonkey’s longitudinal engagement dataset, the following drivers show stagnation or decline across growth cycles:
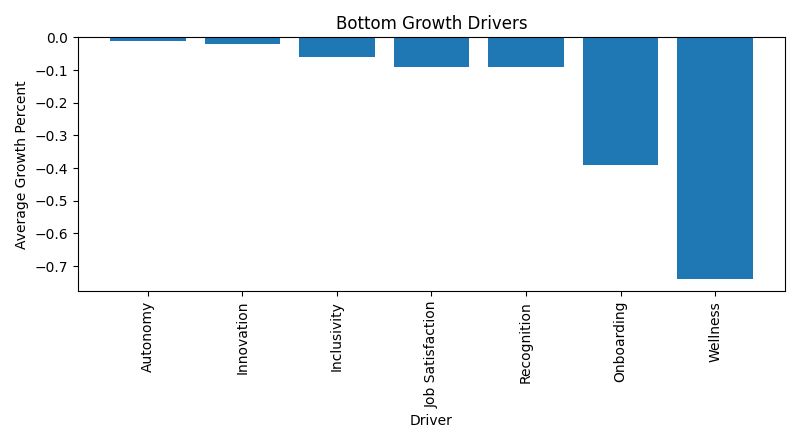
Recognition and wellness appear frequently in vendor marketing but show limited independent growth impact in longitudinal analysis.
Driver impact ranking
Using CultureMonkey’s benchmark dataset, structural multipliers were compared against friction signals to isolate the highest-leverage drivers.
Drivers with the largest positive growth differential
- Involvement
- Leadership
- Meaningful Work
- Manager Support
Drivers with the lowest leverage
- Wellness
- Onboarding
- Recognition
Interpretation
Organizations that prioritize structural drivers outperform those focused primarily on tactical engagement initiatives.
Predictive insight for 2026 planning
Across industries, CultureMonkey’s longitudinal benchmark data shows that engagement growth does not respond equally to all drivers. Instead, engagement demonstrates higher elasticity to structural drivers such as Involvement and Leadership.
In practical terms, engagement lift is leverage-dependent.
Quantitative benchmark example
If an organization improves Involvement by +0.20 points on a five-point scale:
- In CultureMonkey’s modeled engagement elasticity analysis, the directional engagement response ranges between +0.05 to +0.07 points.
- This represents approximately 25–35% proportional translation of driver movement into overall engagement lift.
This estimate reflects directional alignment observed across survey cycles. It is correlation-based, not a causal guarantee. However, the consistency of this relationship across industries makes it strategically meaningful for prioritization.
What this means in simple terms
- Structural drivers function as engagement multipliers.
- Tactical drivers function as engagement stabilizers.
- Engagement lift increases when leading structural indicators move meaningfully.
Organizations that improve leadership clarity, employee involvement, and manager support tend to experience measurable engagement growth. Organizations that invest primarily in recognition or wellness initiatives without structural alignment see limited aggregate movement.
Implication for employee engagement survey providers
For companies evaluating employee engagement survey providers, this insight is critical:
Platforms that only measure sentiment generate visibility. Platforms that enable structural prioritization generate lift.
In 2026, engagement performance depends less on survey frequency and more on driver-level execution architecture.
- Measurement informs.
- Prioritization multiplies.
How to evaluate employee engagement survey vendors?
When selecting an employee engagement survey vendor, ask:
- Does the platform prioritize structural growth drivers?
- Does it enable manager activation?
- Does it embed engagement into operational cadence?
- Does it prevent survey fatigue?
- Does it convert insights into owned actions?
The differentiator is not visualization.
It is an execution architecture.
What high-performing engagement programs do differently?
Organizations showing consistent engagement growth:
- Anchor on 2–3 structural drivers
- Keep survey core stable (6–10 questions)
- Rotate limited focus areas
- Publish results within two weeks
- Assign action ownership
- Coach managers with micro-actions
- Review driver movement quarterly
- Treat engagement as an operational metric
Programs that over-expand surveys, over-index on recognition, or delay action publication plateau faster.
The maturity model of employee engagement survey vendors
Based on observed growth patterns, vendors fall into three categories:
Level 1: Survey Collectors
Measure sentiment. Provide dashboards.
Level 2: Insight Platforms
Deliver diagnostics and benchmarking.
Level 3: Engagement Operating Systems
Embed prioritization, action ownership, and operational rhythm. Sustained engagement growth aligns most strongly with Level 3 systems.
Methodology
This report is based exclusively on CultureMonkey benchmark data derived from more than 10 million anonymized responses across industries:
- 10M+ anonymized responses
- Five-point engagement scale
- Longitudinal driver-level aggregation
- Growth % analysis across multiple survey cycles
- Removal of noise categories
- Cross-industry averaging
- Differential analysis between high-growth and stagnant organizations
Growth percentages represent average movement across reporting cycles and are directional, not causal guarantees.
CultureMonkey for engagement-driven organizations
CultureMonkey is built as an Engagement Operating System enabling organizations to prioritize structural drivers, activate managers, and translate engagement insights into measurable business outcomes.
CultureMonkey’s architecture is directly designed around these structural multipliers, enabling organizations to convert engagement insights into measurable engagement lift.
Typical use cases:
- Leadership trust tracking
- Manager effectiveness coaching
- Driver-level prioritization
- Benchmark comparison
- Action tracking workflows
- Pulse cadence optimization
FAQs
1. What actually differentiates employee engagement survey vendors?
The key differentiator is how well a platform converts feedback into action. Leading employee engagement survey vendors go beyond dashboards by identifying high-impact engagement drivers, activating managers with clear insights, and embedding action planning into daily workflows to sustain engagement improvement.
2. Which drivers matter most for engagement growth?
CultureMonkey’s benchmark analysis of over 10 million survey responses shows that Leadership, Involvement, Meaningful Work, and Manager Support consistently deliver the highest engagement growth impact. These structural drivers influence how employees experience work and strongly correlate with measurable engagement improvement.
3. Does recognition improve engagement?
Recognition helps reinforce positive behavior and prevents dissatisfaction, but benchmark data shows it rarely drives sustained engagement growth on its own. Without strong leadership, involvement, and manager support, recognition programs tend to stabilize engagement rather than significantly increase it.
4. How often should engagement surveys run?
High-performing organizations typically maintain a stable core engagement survey with 6–10 questions and run targeted pulse surveys periodically. Quarterly or action-based cadence works best, allowing teams to measure progress, avoid survey fatigue, and give managers enough time to implement improvements.
5. How can organizations avoid survey fatigue?
Survey fatigue usually occurs when employees give feedback but see no visible action. Organizations reduce fatigue by sharing results quickly, focusing on a small number of improvements, and showing progress regularly. When employees see feedback translating into change, participation and trust both increase.
6. What is the biggest mistake organizations make?
A common mistake is over-investing in tactical initiatives such as wellness programs or recognition campaigns while ignoring structural drivers like leadership clarity, employee involvement, and manager capability. Without strengthening these foundations, engagement programs often generate activity but limited long-term improvement.


