

Engagement KPIs for construction operations: 8 to track
Engagement KPIs for construction operations measure workforce behavior across sites using metrics like attendance, safety reporting, and attrition signals. These KPIs reflect real site conditions, workforce stability, and early risk indicators across project phases.
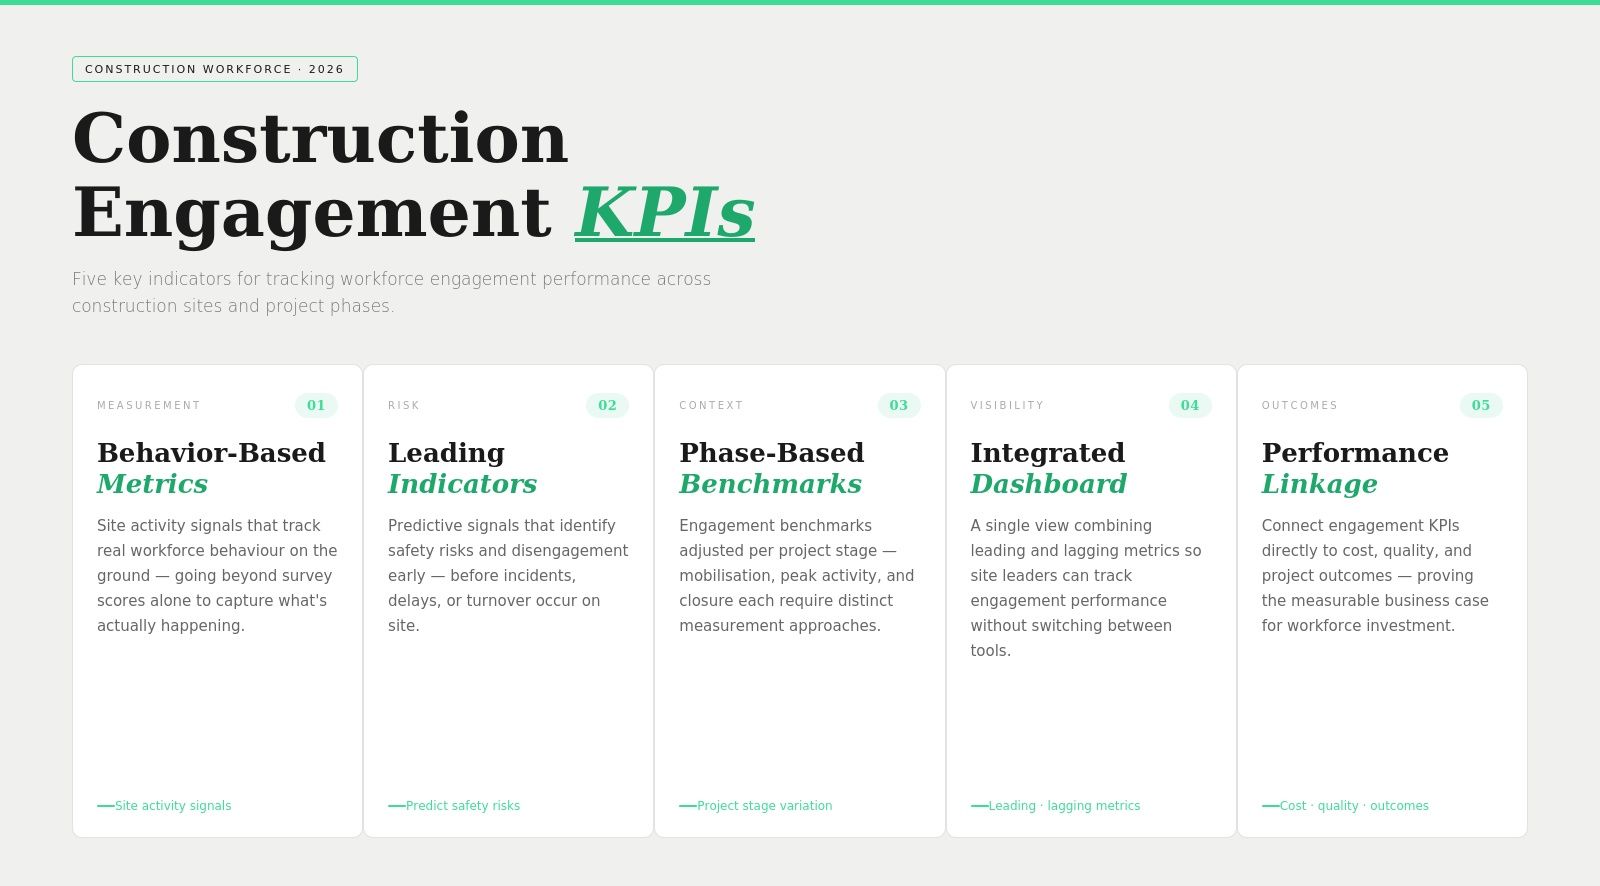
Generic satisfaction scores fail in construction because they ignore project timelines, site conditions, workforce differences, site environments, and role-based differences. They show that something is wrong but do not explain where, when, or why issues occur across construction operations.
This guide explains 8 construction-specific engagement KPIs, including benchmarks, risk thresholds, and how each metric connects to safety incidents, workforce retention, and project delivery outcomes, supported by the right employee survey tools to capture accurate, site-level data.


- Engagement KPIs for construction operations must reflect site behavior, not generic employee satisfaction scores.
- Leading indicators help construction managers act before problems damage safety performance or project outcomes.
- Construction benchmarks should vary by project phase, workforce mix, and site maturity.
- A strong dashboard combines leading and lagging indicators across construction sites and project timelines.
- CultureMonkey helps construction organizations capture real-time engagement signals through multilingual surveys, enabling faster decisions and better project outcomes.
Why standard engagement KPIs don't work in construction

Standard engagement KPIs fail in construction because they do not reflect site conditions, project phases, or workforce structure. They miss three structural realities in the construction industry: limited worker access, project-phase variance, and mixed workforce data pooling, which weakens data collection and reduces measurable value.
No desk-based access.
Construction engagement data is often incomplete because many workers on the job site do not use email, laptops, or always-on internal platforms. This means survey-based employee engagement data often reflects administrative staff more than frontline construction teams, which creates biased key metrics and weakens KPI tracking.
Project-phase variance.
Engagement in construction projects changes across mobilization, peak execution, and closeout. Static key performance indicators (KPIs) hide these shifts, making it harder for project managers and construction managers to separate normal engagement movement from genuine project risk.
Mixed workforce data pooling.
Construction companies often combine direct employees, subcontractors, and labor-hire workers into one engagement view. That single workforce view distorts performance data, reduces actionable insights, and makes it harder to align KPI data with project and company goals.
| Generic KPI assumption | Construction reality | Impact |
|---|---|---|
| Survey access via email | Site workers often lack desk-based access | Skewed employee engagement data |
| Static benchmarks | Engagement shifts across project timelines | Misleading insights |
| Single workforce view | Multiple employment types are pooled together | Data distortion |
| One survey method fits all | Construction environments need flexible data collection methods | Low participation and weak signal quality |
The 8 construction-specific engagement KPIs

The most useful engagement KPIs for construction operations are toolbox talk attendance rate, voluntary near-miss reporting rate, absenteeism rate by trade, re-engagement rate at mobilization, supervisor trust score, voluntary turnover by site, eNPS by project phase, and survey participation rate. These construction KPIs measure workforce behavior, trust, communication reach, and retention risk more accurately than generic satisfaction metrics.
In short: The most effective construction engagement KPIs track communication, trust, participation, and retention risk across project phases.
1. Toolbox talk attendance rate.
Toolbox talk attendance rate measures how consistently workers attend daily safety briefings, making it a key leading indicator of communication reach and workforce engagement across construction sites.
- Data source: Site logs and supervisor records
- Risk signal: Low attendance indicates weak communication and reduced engagement
- Impact: Affects safety performance, planned progress, and overall project efficiency
- Formula: (Number of workers attending toolbox talks ÷ Total workers scheduled) × 100
- Threshold: Consistently low attendance signals weak communication reach and reduced workforce engagement.
2. Voluntary near-miss reporting rate.
Voluntary near-miss reporting rate tracks how often workers report hazards before incidents occur, making it one of the strongest leading indicators of psychological safety in construction teams.
- Data source: Safety logs and reporting systems
- Risk signal: Low reporting suggests low trust or fear of escalation
- Impact: Directly affects safety performance and visibility into risk
- Formula: (Number of voluntary near-miss reports ÷ Total workers) × 100
- Threshold: Declining reporting indicates low psychological safety and reduced trust in management.
3. Absenteeism rate by trade.
Absenteeism rate by trade measures workforce absence patterns within specific trades, helping construction managers identify disengagement and instability within crews.
- Data source: Payroll systems and attendance tracking
- Risk signal: Rising absenteeism indicates disengagement and potential attrition
- Impact: Affects labor productivity, project timelines, and cost control
- Formula: (Number of absent workers in a trade ÷ Total workers in that trade) × 100
- Threshold: Rising absenteeism signals disengagement, fatigue, or early attrition risk.
4. Re-engagement rate at mobilization.
Re-engagement rate at mobilization measures how many workers return and recommit at the start of new construction projects, reflecting workforce continuity across multiple projects.
- Data source: HRIS and workforce planning data
- Risk signal: Low return rates indicate a weak workforce connection
- Impact: Affects resource allocation, project continuity, and future projects
- Formula: (Number of returning workers ÷ Total workers invited back) × 100
- Threshold: Low re-engagement indicates weak workforce loyalty and instability across future projects.
5. Supervisor trust score.
Supervisor trust score measures worker confidence in their foreman or supervisor, making it a critical leading indicator of team cohesion and construction performance.
- Data source: Pulse surveys or feedback tools
- Risk signal: Low trust signals leadership gaps and communication issues
- Impact: Influences safety performance, engagement levels, and project outcomes
- Formula: (Average trust score from worker responses ÷ Total responses)
- Threshold: Low scores indicate weak foreman effectiveness and poor crew relationship quality.
6. Voluntary turnover by site.
Voluntary turnover by site tracks how many workers leave a specific construction site by choice, helping identify localized engagement problems.
- Data source: HR and exit data
- Risk signal: High turnover highlights problem construction sites
- Impact: Affects cost efficiency, workforce stability, and project timelines
- Formula: (Number of voluntary exits ÷ Average workforce size at site) × 100
- Threshold: High turnover concentration identifies problem construction sites and engagement breakdown.
7. eNPS by project phase.
eNPS by project phase measures employee sentiment across different stages of construction projects, capturing how engagement shifts over time.
- Data source: Survey tools
- Risk signal: Declining sentiment signals disengagement during execution phases
- Impact: Affects morale, retention, and overall project success
- Formula: (% Promoters − % Detractors)
- Threshold: Declining eNPS across phases signals engagement drop during execution and delivery pressure.
8. Survey participation rate.
Survey participation rate measures how many workers actively provide feedback, making it a leading indicator of data reliability and workforce voice confidence.
- Data source: Survey tools and response tracking
- Risk signal: Low participation reduces visibility into workforce issues
- Impact: Weakens actionable insights and tracking performance accuracy
- Formula: (Number of responses ÷ Total workers surveyed) × 100
- Threshold: Low participation reduces data reliability and weakens actionable insights.
Leading vs lagging indicators in construction engagement
Leading indicators in construction engagement show early workforce behavior, while lagging indicators confirm outcomes after performance issues appear. In construction management, leading indicators matter more because they give project managers time to act before safety incidents, cost overruns, or productivity losses affect project performance.
| Type | Examples | What it shows | Timing |
|---|---|---|---|
| Leading indicators | Toolbox talk attendance, voluntary near-miss reporting, supervisor trust score, survey participation rate, and re-engagement at mobilization | Engagement behavior, communication quality, and workforce confidence | Early |
| Lagging indicators | Voluntary turnover by site, absenteeism rate by trade, eNPS by project phase, client satisfaction impact, and project outcomes | Outcome, stability, sentiment decline, and operational fallout | Late |
Leading indicators are more useful in construction operations because planned progress can break down quickly when worker commitment, trust, or communication weakens. Lagging indicators still matter because they validate whether earlier warning signs turned into actual progress issues, project completion risk, or broader construction performance problems.
Key takeaway: Leading indicators help prevent project risk, while lagging indicators confirm whether engagement issues have already impacted outcomes.
How engagement KPIs connect to safety performance.
Engagement KPIs directly predict safety performance because lower participation, weak communication, and reduced reporting appear before incidents occur, report fewer risks, and participate less consistently in site routines. In construction sites, lower engagement usually shows up before higher safety incidents, which makes engagement data one of the most practical leading indicators available to construction managers.
| Engagement KPI | Safety outcome link |
|---|---|
| Low toolbox talk attendance | Higher chance of missed safety communication and incident exposure |
| Low voluntary near-miss reporting | Hidden risk accumulation and lower hazard visibility |
| High absenteeism by trade | Fatigue pressure, crew instability, and increased error risk |
| Low supervisor trust score | Lower compliance, weaker escalation, and reduced crew openness |
| Low survey participation rate | Poor visibility into site risk and weak worker voice confidence |
Why engagement predicts safety in construction.
Construction safety research shows that many site incidents are linked to worker actions, supervision gaps, and limited safety awareness. The Health and Safety Executive (HSE) reports that the construction industry employs just over 6% of the workforce but accounts for over 30% of fatal injuries.
HSE studies also show that improving how safety information reaches site operatives increases awareness and information uptake, which are critical for reducing risk on construction sites.
Practical interpretation on site.
Project managers should not treat weak engagement as a soft HR issue. They should treat it as an operational risk that affects construction project KPIs, labor costs, resource allocation, and overall project efficiency.
Setting engagement benchmarks for construction sites.
Construction engagement benchmarks must be set by context, not by universal averages. The best benchmark compares similar construction sites by project phase, workforce mix, and site maturity, using historical data to create realistic targets for continuous improvement.
By project phase.
Engagement is usually strongest during mobilization, less stable during heavy execution, and most fragile near closeout. Benchmarking without phase context creates false comparisons across construction projects.
(Source: HSE)
By workforce mix.
A direct-hire-heavy site, a subcontractor-heavy site, and a blended workforce site will not produce the same employee engagement pattern. Workforce mix should shape benchmark expectations and data collection methods.
By site maturity.
Newer sites may show higher optimism and stronger participation, while mature sites may show fatigue, lower survey participation, or weaker re-engagement. Site maturity matters for interpreting both leading indicators and lagging indicators.
| Context | Example benchmark pattern |
|---|---|
| Early phase | High participation, stronger trust, higher optimism |
| Mid execution | Stable attendance but lower sentiment and reporting consistency |
| End phase | Higher turnover risk, lower participation, and re-engagement uncertainty |
| Direct-hire dominant site | More stable participation and cleaner KPI data |
| Subcontractor-heavy site | More variable engagement and harder data collection |
Do not compare construction operations against generic cross-industry employee engagement benchmarks. Do not set one benchmark for multiple projects with different project goals, labor models, or site maturity levels. Do not ignore actual progress, project milestones, or historical data when evaluating benchmark movement.
In practice: Construction benchmarks must be based on project phase, workforce mix, and site maturity to reflect real operating conditions.
Building a construction engagement KPI dashboard.
A construction engagement KPI dashboard should combine four leading indicators and four lagging indicators, segmented by site and project phase, so teams can track performance in a way that supports operational decisions. A usable dashboard turns raw KPI data into actionable insights for construction management, cost control, and better project outcomes.
Steps to build the dashboard.
- Select four leading indicators that reveal early workforce behavior.
- Select four lagging indicators that confirm outcome-level risk.
- Segment data by construction sites.
- Segment data by project phase.
- Review trend lines, not single snapshots.
- Connect engagement movement to safety performance, labor productivity, and project efficiency.
- Share the dashboard in a format that allows project managers to act quickly.
| Dashboard section | KPI type | Example |
|---|---|---|
| Site view | Leading | Toolbox talk attendance rate |
| Site view | Lagging | Voluntary turnover by site |
| Project phase view | Leading | Re-engagement rate at mobilization |
| Project phase view | Lagging | eNPS by project phase |
| Trade view | Leading | Survey participation rate |
| Trade view | Lagging | Absenteeism rate by trade |
A strong dashboard helps construction firms move from passive reporting to tracking performance that improves project outcomes. It also supports better resource allocation, stronger construction metrics, and sound and confident decisions across multiple software platforms when data sources are connected cleanly.

What gets measured gets improved, but only if you’re measuring the right behaviors on the ground.

How to report engagement KPIs to project leadership.
Engagement KPIs must be translated into business and site language before project leadership will act on them. Project directors, construction managers, and CFOs do not respond to abstract sentiment scores alone. They respond to signals that affect schedule performance, cost efficiency, safety performance, project costs, and project success.
| KPI | HR language | Leadership translation |
|---|---|---|
| Absenteeism rate by trade | Percentage absent | Risk to labor productivity, schedule performance, and labor costs |
| Low survey participation | Participation issue | Weak visibility into site conditions and worker concerns |
| Low toolbox talk attendance | Attendance problem | Communication gap that may affect safety performance |
| Weak supervisor trust score | Engagement decline | Foreman effectiveness issue that can affect project efficiency |
| Voluntary turnover by site | Attrition rate | Problem site indicator with risk to future projects and cost control |
| Low near-miss reporting | Low reporting culture | Safety blind spots and hidden incident risk |
What CFOs care about is whether engagement affects financial performance, cost management, indirect costs, and cost overruns. What project directors care about is whether engagement affects track progress accuracy, project timelines, planned progress, actual progress, and project completion. What construction business leaders care about is whether engagement supports repeat business, client satisfaction, customer satisfaction, and better project outcomes.
Conclusion
Engagement KPIs for construction operations are critical for understanding workforce behavior, improving safety performance, and ensuring consistent project outcomes across construction sites.
Unlike generic metrics, these KPIs provide actionable insights that help construction managers track progress, reduce safety incidents, and improve labor productivity. Without the right key performance indicators, construction companies risk making decisions based on incomplete or misleading data.
To act on these metrics effectively, organisations need the Best employee survey tools for construction companies that enable real-time data capture, workforce segmentation, and site-level visibility.
CultureMonkey helps construction organizations capture real-time employee engagement signals across sites through flexible data collection methods, multilingual surveys, and role-based dashboards, enabling better decision-making, stronger workforce alignment, and continuous improvement across multiple projects.
Last reviewed: April 2026
FAQs
1. What are construction engagement KPIs?
Construction engagement KPIs track workforce behavior, trust, participation, and stability on job sites. Key metrics include toolbox talk attendance, near-miss reporting, absenteeism by trade, re-engagement at mobilization, supervisor trust score, voluntary turnover, eNPS, and survey participation rate.
2. What KPIs measure employee engagement in construction?
The most effective construction engagement KPIs are toolbox talk attendance, voluntary near-miss reporting, absenteeism by trade, re-engagement at mobilization, supervisor trust score, voluntary turnover by site, eNPS by project phase, and survey participation rate. Leading KPIs predict risk early.
3. How do engagement KPIs relate to safety performance?
Lower toolbox attendance, reduced near-miss reporting, and weak supervisor trust consistently appear before safety incidents on construction sites. These signals indicate communication breakdowns and psychological safety gaps that increase on-site risk exposure and reduce hazard visibility across crews.
4. What is a good engagement score for a construction company?
There is no single good engagement score for construction companies because workforce behavior shifts by project phase, workforce mix, and site maturity. Meaningful benchmarks compare similar construction sites using historical data and phase context instead of generic cross-industry averages.
5. How do you measure engagement on construction sites?
Measure engagement on construction sites by combining observable workforce behavior with short feedback loops. Track toolbox attendance, near-miss reporting, absenteeism by trade, re-engagement at mobilization, supervisor trust scores, voluntary turnover, eNPS, and survey participation by phase.
6. What are leading vs lagging KPIs in construction engagement?
Leading indicators show early construction workforce behavior: attendance, near-miss reporting, supervisor trust, and participation. Lagging indicators confirm outcomes like absenteeism, turnover, and eNPS decline. In construction, leading indicators matter more as they enable early intervention.
7. How should construction companies set engagement benchmarks?
Construction companies should set engagement benchmarks by comparing similar sites, workforce mixes, and project phases using internal historical data. Benchmarks must reflect actual operating conditions, including phase variance and workforce type, not generic cross-industry averages.
8. Why do generic employee surveys fail in construction operations?
Generic surveys fail in construction because they assume desk-based access, stable teams, and uniform conditions. Construction environments are mobile, phase-based, and mixed-workforce, so generic survey data misses frontline issues and produces weak signals that cannot support actionable site decisions.


