

eNPS benchmark: What your score really means
eNPS benchmark compares your employee Net Promoter Score against industry averages, regional data, and peer company ranges to determine whether your score is strong, average, or weak. Without this comparison, eNPS scores lack context.
This guide is based on tested frameworks and explains how to interpret benchmark ranges, identify gaps, and apply insights to improve employee experience with clear, data-driven actions.


- eNPS benchmark compares employee Net Promoter Score against industry and peer benchmarks to determine employee sentiment.
- Benchmarking adds context to eNPS scores, helping identify gaps, track trends, and avoid misleading conclusions from isolated internal data.
- eNPS benchmarks vary by industry, company type, and region, so relevant comparison groups matter more than fixed score ranges.
- Effective eNPS benchmarking requires segmentation, consistent measurement, and tools to track trends and act on feedback continuously.
- CultureMonkey helps benchmark eNPS accurately by combining segmentation, trend tracking, and actionable insights to improve employee experience at scale.
What is an eNPS benchmark?
An eNPS benchmark compares your employee Net Promoter Score against industry averages and peer company ranges to determine if your score is strong, average, or weak. It converts a raw score into a relative performance indicator.
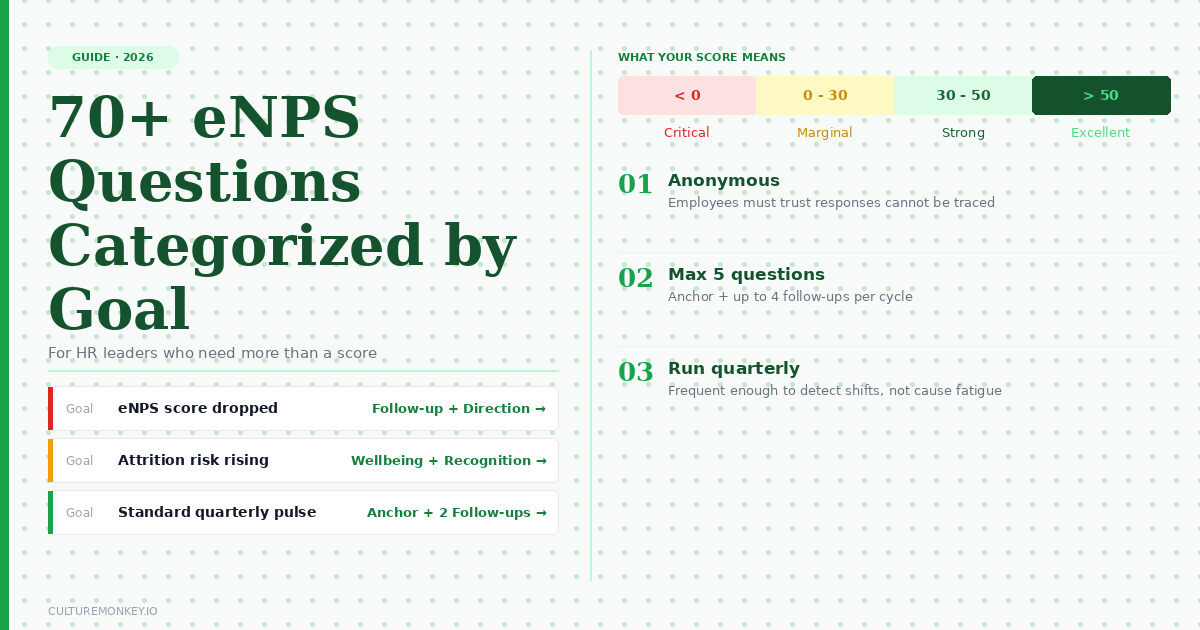
Typical eNPS benchmark scores range from 10 to 30 as good, 30 to 50 as very good, and above 50 as excellent, though this varies by average eNPS score by industry and workforce conditions.
Without benchmarks, eNPS scores lack context and cannot reliably indicate employee loyalty, retention risk, or competitive positioning. Scores between 30 and 50 are strong, indicating strong alignment and enthusiasm. Scores below 0 signals widespread dissatisfaction.
How to measure eNPS and calculate your eNPS score?

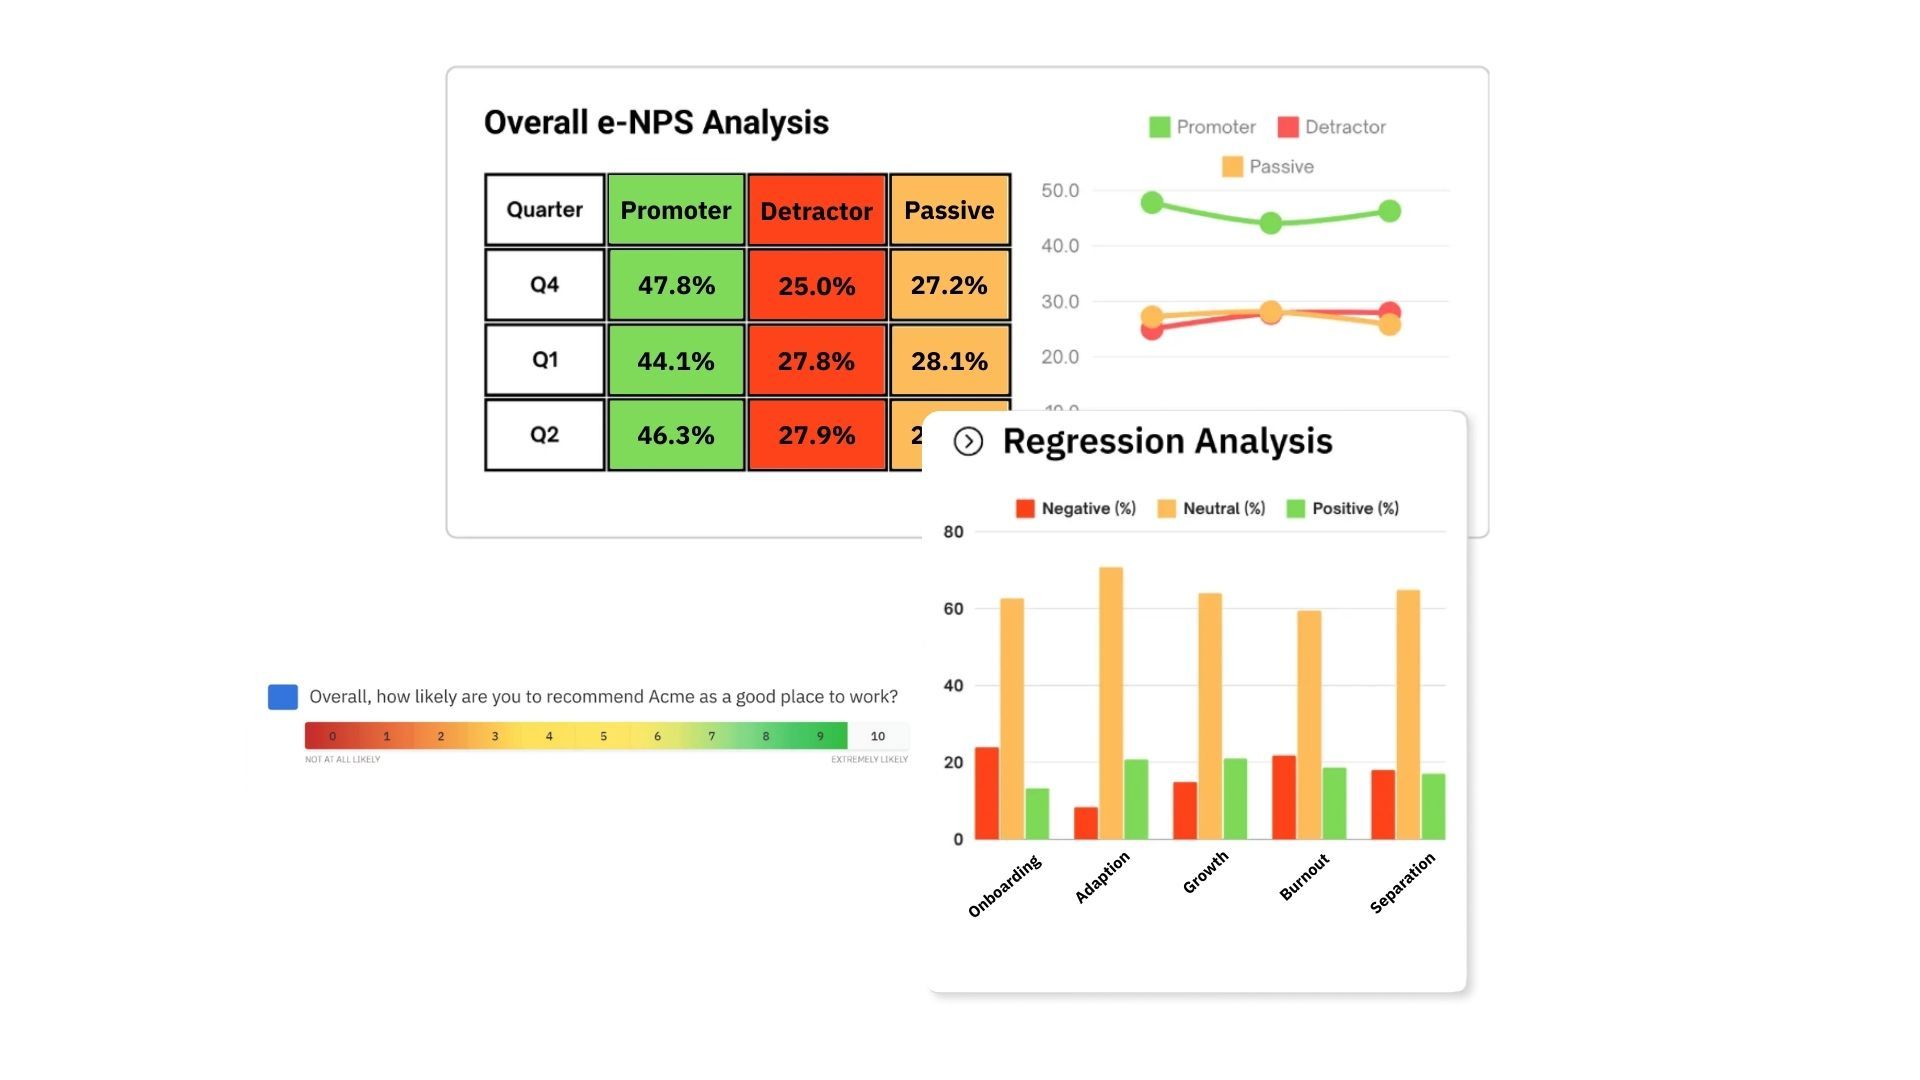
eNPS is measured by asking a single question: how likely employees are to recommend your organization on a 0–10 scale. Responses are grouped into promoters (9–10), passives (7–8), and detractors (0–6). The eNPS score is calculated as the percentage of promoters minus the percentage of detractors.
This method provides a standardized way to quantify employee sentiment, which is then compared against benchmarks to evaluate performance. eNPS is derived from the Net Promoter Score (NPS), which measures customer loyalty and satisfaction.
| eNPS Classification Score Range | Interpretation | What it Indicates |
|---|---|---|
| Below 0 | Poor | High disengagement and retention risk |
| 0 to 20 | Average | Mixed sentiment and uneven experience |
| 20 to 50 | Strong | Consistent engagement and stable culture |
| 50 to 70 | Excellent | High advocacy and strong workplace experience |
| 70 to 100 | Best-in-class | Rare, highly loyal and motivated workforce |
What your eNPS score signals
- Low scores → Structural issues in leadership, workload, or trust.
- Mid-range scores → Inconsistent employee experience across teams.
- High scores → Strong culture but may still hide localized gaps.
- Rapid score shifts → Changes in management, policy, or employee expectations.
Communicating changes made based on employee feedback reinforces the value of their input, leading to boost eNPS with a positive score. High eNPS scores are associated with higher employee autonomy and improved company culture.
Benchmark context
The eNPS question typically asks employees how likely they are to recommend their organization to a friend or colleague on a scale of 0 to 10.
- The same eNPS score does not carry the same meaning in every organization.
- Industry, company size, geography, and workforce structure can affect benchmark expectations.
- A score should be interpreted against relevant comparison groups of employee NPS score benchmarks and not in isolation.
- Employee tenure can influence eNPS scores, with new hires and long-tenured employees often reporting the highest satisfaction.
Analyzing feedback patterns helps identify recurring themes and areas needing attention. Implementing flexible work arrangements can enhance work-life balance and improve employee satisfaction.

If the reputation of a company’s products and services is its face, the talent brand is its heart and soul.
Rusty Rueff

![]()
Member Board of Directors at coexperiences
What is a good eNPS benchmark across industries?

A good eNPS benchmark depends on the comparison group rather than a fixed number. Most organizations fall within a moderate range, but strong performance is defined by how your score compares to relevant eNPS industry benchmarks and peer groups.
A reliable employee net promoter score benchmark should always reflect similar industry conditions, workforce type, and company scale, not broad averages.
What defines a strong benchmark
- A score is strong only when it exceeds comparable eNPS benchmark scores.
- Employee net promoter scores by industry vary across industries, making direct comparisons unreliable.
- The same score may be above or below employee net promoter score benchmarks depending on context.
Recognition programs can significantly boost employee morale and engagement. Effective leadership boosts trust and morale among employees, enhancing engagement.
Types of eNPS benchmarks used
- Industry benchmarks → Compare performance within similar sectors.
- Company size benchmarks → Adjust for scale and organizational complexity.
- Role or department benchmarks → Identify differences across functions like sales, engineering, or operations.
- Lifecycle benchmarks → Measure sentiment at stages such as onboarding, mid-tenure, and exit.
- Geographic benchmarks → Reflect regional workforce expectations.
Taking action on employee feedback builds trust and encourages future participation in surveys. A strong and positive work environment is essential for employee loyalty and engagement.
How to use benchmarks correctly
- Compare against the closest peer group, not generalized averages.
- Use benchmarks to identify performance gaps, not vanity metrics.
- Track movement against eNPS benchmarks over time, not just static scores.
Providing clear opportunities for career advancement is crucial for employee satisfaction and retention. Competitive salaries, regular salary reviews and robust benefit structures are foundational for maintaining employee satisfaction and avoiding detractor status.
How eNPS benchmarks vary by region and company type
eNPS benchmarks vary by region and company type due to differences in cultural response patterns, workforce composition, and organizational structure, which directly influence how employees rate and experience the workplace.
Region vs company type
Region
- Cultural employee response patterns influence how employees rate on the nps score scale.
- Local labor conditions and expectations affect sentiment reporting.
Company type
- High-growth → more volatile eNPS scores.
- Enterprise → more stable averages.
- Frontline-heavy → wider variation across locations.
What to remember
- A single company's eNPS score benchmark does not apply across regions or company models.
- Compare against relevant employee NPS benchmarks for accurate evaluation.
Regularly conducting eNPS surveys without survey fatigue allows firms to track the impact of company changes on employee morale over time. Tech firms and startups often report higher eNPS scores due to culture and benefits, while traditional industries may see lower averages.
Best practices and tools for benchmarking eNPS effectively
Effective eNPS benchmarking relies on applying structured best practices such as consistent measurement, segmentation, and relevant comparisons, supported by the best tools for benchmarking eNPS that enable data collection, analysis, and trend tracking.
Collect correctly to define data quality
Use eNPS survey software or an eNPS survey tool to standardize how employee responses are captured.
If this fails:
- Low eNPS scores are inconsistent.
- Benchmarks become unreliable.
Analyze correctly to define benchmark accuracy
Use an eNPS tool or eNPS software to segment results by role, region, and lifecycle.
If this fails:
- Benchmarks stay surface-level.
- Gaps remain hidden inside averages.
Track correctly to define benchmark usefulness
Use tools to visualize eNPS trends over time to monitor movement and detect shifts early.
If this fails:
- Benchmarking becomes static.
- No visibility into improvement or decline.
Closing the feedback loop with employees shows them that their input leads to real change, which can improve future engagement.
What effective benchmarking looks like
- Benchmarks are continuously updated, not point-in-time.
- Comparisons are made within relevant peer groups.
- Scores are tied to actions, not just visibility.
- Tools are used to identify gaps, not to validate performance.
Leading companies often achieve eNPS scores between 30 and 50, while scores above 50 are considered excellent and indicate strong employee satisfaction and loyalty.
(Source: EY)
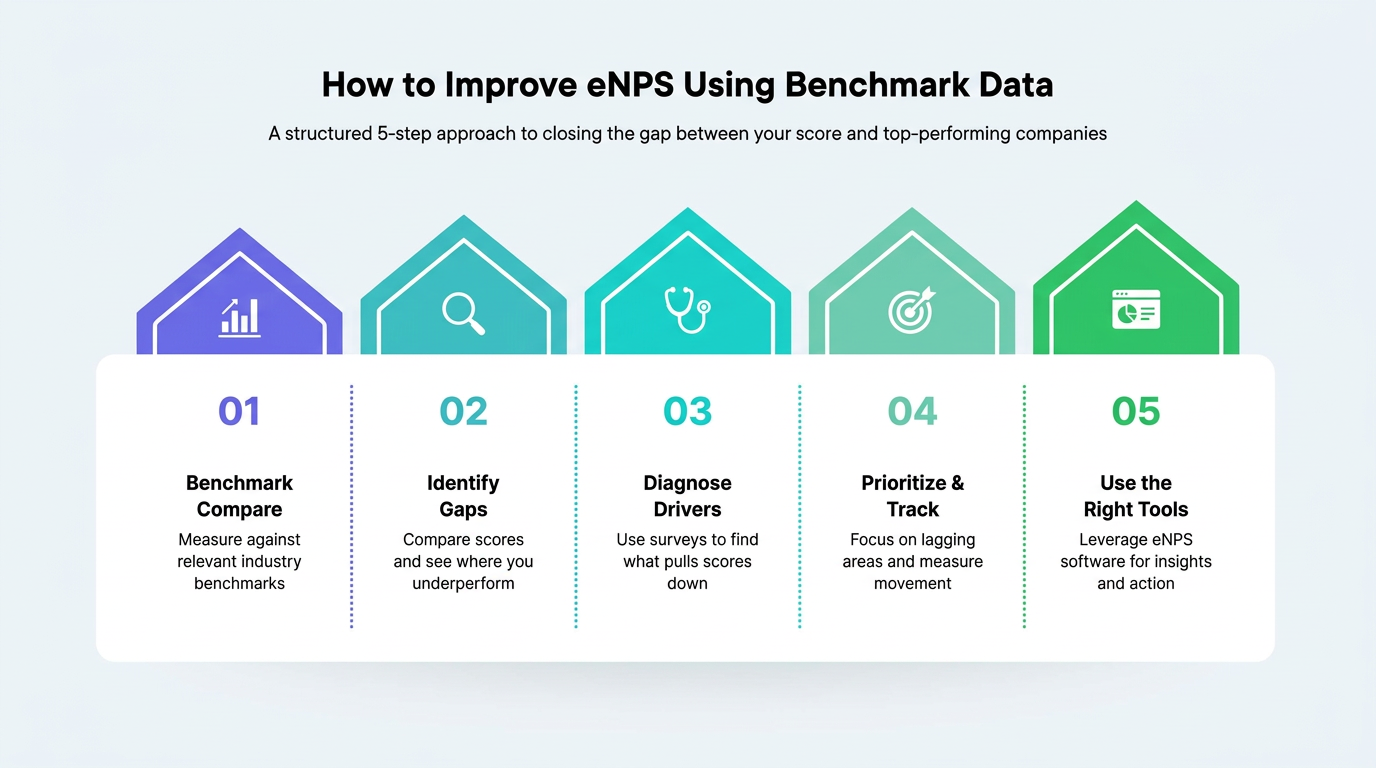
How to improve eNPS using benchmark data?

Improve eNPS by comparing your score against relevant eNPS benchmark, identifying gaps, and taking targeted action where you fall below expected employee net promoter score benchmark levels.
- Identify gaps: Compare against eNPS benchmarks and employee net promoter score by industry to see where you underperform.
- Diagnose drivers: Use your eNPS survey to find what is pulling your eNPS scores down.
- Prioritize action: Focus on areas lagging behind the benchmark eNPS, not overall averages.
- Track movement: Measure changes using consistent eNPS calculation and trend tracking with eNPS scores for top companies.
- Use the right tools: An eNPS tool or eNPS software helps segment, benchmark, and act on insights.
Using qualitative data from open-ended responses can provide insights into the reasons behind eNPS scores. It's important to communicate that feedback is confidential to encourage honesty in eNPS surveys.
Limitations of eNPS benchmarking and how to overcome them
eNPS benchmarking has limitations because scores lack context, comparisons can be misaligned, and aggregated data can hide real issues, making interpretation unreliable without the right approach.
- Lack of context: An eNPS score reflects sentiment but not the reasons behind it, making decisions unclear without additional input.
- Single-metric limitation: A single employee net promoter score (eNPS) cannot capture the full employee experience or explain shifts in engagement.
- Incorrect benchmark comparison: Using irrelevant employee NPS score benchmarks without understanding the eNPS meaning behind the score leads to misleading conclusions.
- Aggregation bias: Overall eNPS scores hide variation across roles, teams, and locations.
- Static benchmarking: One-time comparison against an eNPS score benchmark fails to identify trends or movement over time.
After gathering eNPS data, follow up with open-ended questions to understand why employees gave their scores.
How to overcome these limitations
- Add qualitative inputs: Use eNPS questions within your eNPS survey to understand why highly engaged employees respond the way they do.
- Expand beyond one metric: Combine employee net promoter score insights with engagement drivers like recognition, leadership, career growth opportunities and workload.
- Benchmark correctly: Compare against relevant employee net promoter score by industry, not generic averages.
- Segment data: Use an employee net promoter system or eNPS software to break down results across key dimensions.
- Track continuously: Monitor changes of employee NPS benchmarks by industry over time using structured analysis instead of relying on one-time comparisons.
Conclusion
eNPS benchmarking helps organizations move from isolated scores to meaningful comparisons by evaluating performance against relevant benchmarks. When applied correctly, it highlights gaps, guides action, and improves employee experience through structured, data-driven decisions.
CultureMonkey enables this by combining powerful eNPS software, real-time segmentation, and actionable insights. It helps teams benchmark accurately, track trends, and act on employee feedback continuously, turning eNPS into a reliable system for improving engagement, employee retention, and overall workplace performance.
Book a demo with CultureMonkey.
FAQs
1. What is the best tool for benchmarking eNPS?
The best tools for benchmarking eNPS include CultureMonkey, Qualtrics, and Workday Peakon, combining survey distribution, segmentation, and benchmarking features. An eNPS tool should support comparison against employee net promoter score benchmarks and enable accurate analysis across employee NPS benchmarks.
2. What are eNPS classifications?
eNPS classifications group employee responses into promoters, passives, and detractors based on the NPS score scale. These categories help interpret employee net promoter score by segmenting sentiment levels and identifying how employees feel about their workplace.
3. What is a good eNPS score?
A good eNPS score indicates more promoters than detractors, but it should be evaluated against eNPS benchmarks and employee NPS benchmarks. A positive eNPS score may still be average when compared to relevant eNPS industry benchmarks and peer group performance levels.
4. What is a good eNPS score benchmark?
A good eNPS score benchmark depends on context rather than a fixed number. It should be compared against employee net promoter score benchmark data and eNPS benchmark scores within similar industries, company types, and workforce structures and relevant peer groups for accurate evaluation.
5. What does eNPS stand for?
eNPS stands for employee net promoter score, a metric used to measure employee loyalty and satisfaction. It is widely used in an employee net promoter system to assess engagement and understand how employees feel about their workplace experience and overall sentiment levels.
6. How to calculate eNPS?
To calculate eNPS, subtract the percentage of detractors from the percentage of promoters using responses from an eNPS survey. This eNPS calculation provides a score used to compare employee sentiment against eNPS benchmarks and track engagement trends over time for analysis.
7. What is eNPS?
eNPS, or employee net promoter score, is a metric that measures employee loyalty by asking how likely they are to recommend their workplace. It is a simple method to capture employee NPS and understand overall workplace sentiment across teams and departments clearly.
8. What is eNPS benchmark?
An eNPS benchmark compares your eNPS score against eNPS benchmarks, eNPS industry benchmarks, and employee net promoter score benchmarks. It helps determine whether your score reflects strong, average, or weak employee sentiment across different teams, locations, and workforce segments clearly.
9. How to use eNPS for employee engagement?
Use eNPS survey data and eNPS questions to identify gaps, segment feedback, and track changes. Combining insights with eNPS software helps turn employee net promoter score data into actions that improve engagement across teams and roles over time through targeted interventions.


