

eNPS score range Explained (What’s a Good Score?)
Employee Net Promoter Score often creates confusion because teams struggle to decide whether their score is actually good or a warning signal. A number alone does not indicate performance without understanding ranges, context, and comparison across similar organizations.
This blog focuses on interpreting eNPS scores by explaining ranges, what qualifies as good, and how to evaluate results correctly. It helps HR leaders, decision-makers, and HR teams understand meaning and direction without going into calculation methods or detailed improvement strategies.


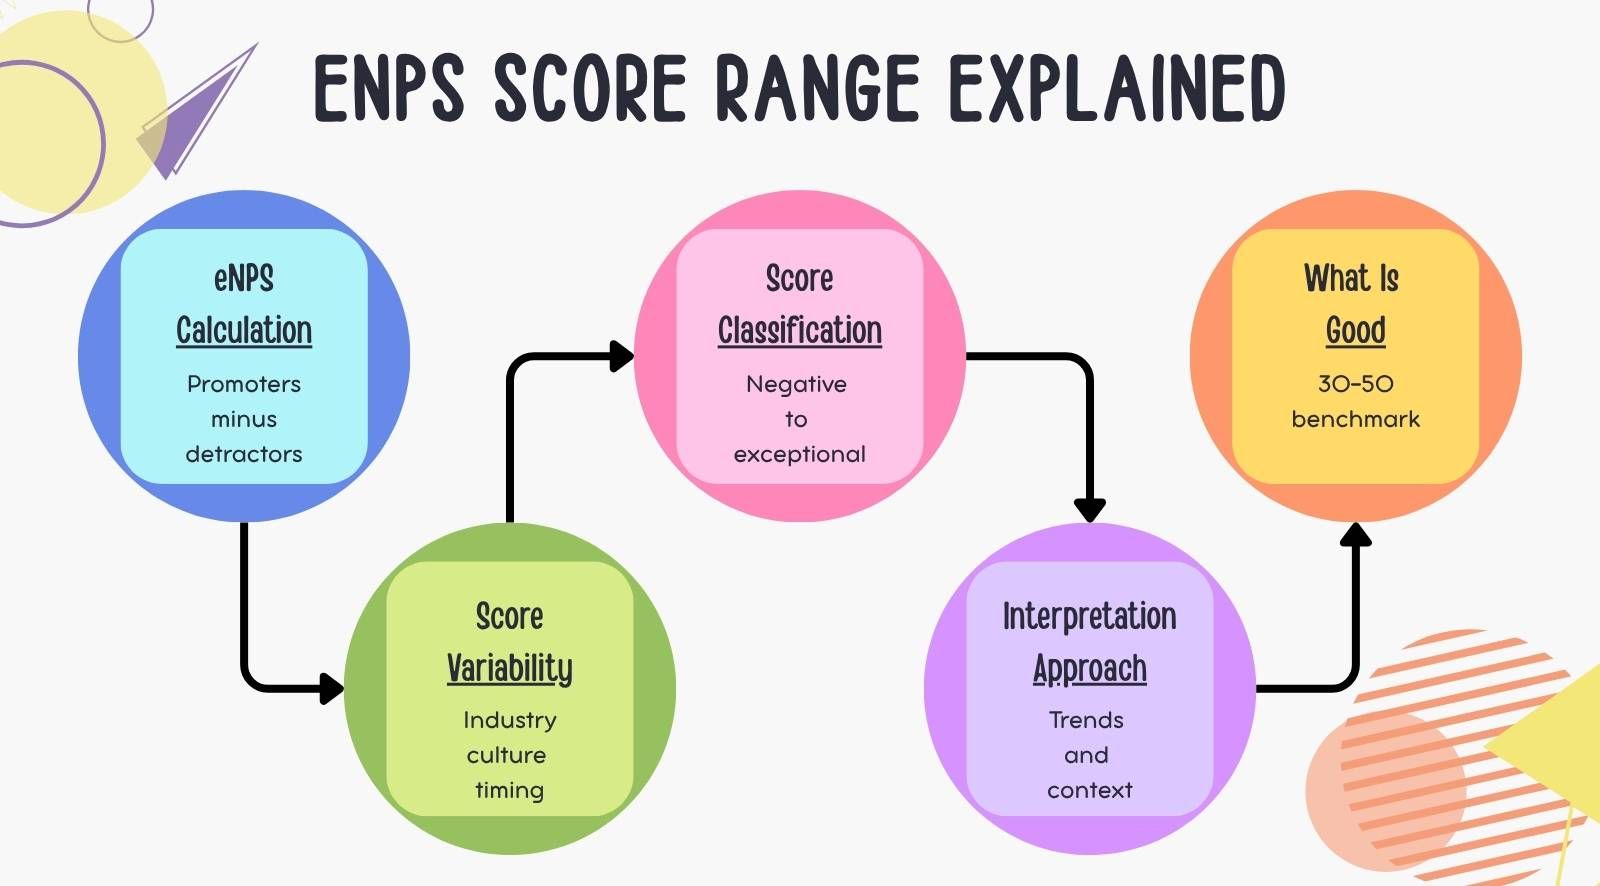
- eNPS measures employee loyalty by subtracting detractors from promoters, showing overall sentiment quickly
- Score ranges classify sentiment from negative (risk) to exceptional (strong advocacy) for clear interpretation
- A “good” eNPS is typically 30–50 but depends on industry, company size, and maturity
- Scores vary due to factors like culture, industry pressure, geography, and timing of surveys
- Correct interpretation focuses on trends, context, and segmentation rather than a single score
What is an eNPS score?
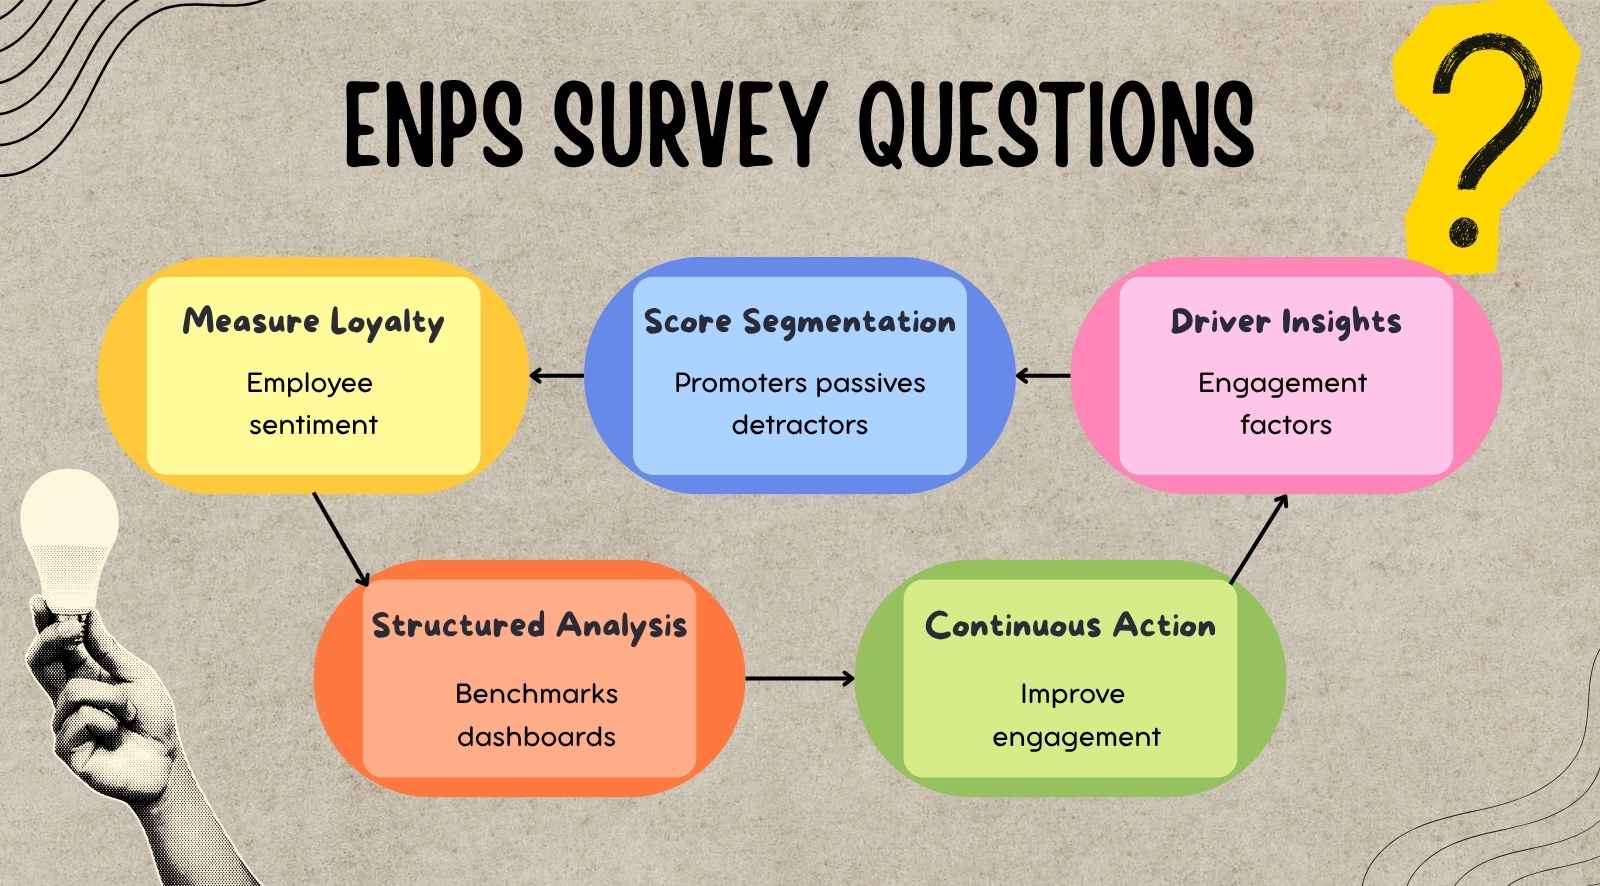
An eNPS score measures employee loyalty by calculating the difference between promoters and detractors. It shows how likely employees are to recommend their organization as a workplace, making it a quick indicator of overall engagement and sentiment. This explains what the eNPS score is in a practical context.
A negative score occurs when there are more detractors than promoters, indicating less favorable employee sentiment. Positive scores indicate more promoters than detractors, while negative scores signal dissatisfaction.
In the enps score calculation, only promoters (employees who score 9 or 10 and are likely to recommend the organization) and detractors are counted, while passive respondents (those who score 7 or 8) are excluded from the calculation.
The eNPS methodology is adapted from the Net Promoter Score, which measures customer loyalty, and is often referred to as eNPS in HR analytics. This helps leadership quickly understand whether employee sentiment is favorable or declining.
eNPS is used as a high-level signal rather than a detailed diagnosis. It highlights shifts in employee sentiment over time, helping organizations identify when deeper analysis is needed to understand underlying drivers and workforce concerns. For calculation details, refer to the dedicated eNPS calculation guide.
What are the eNPS score ranges?
An eNPS score range helps classify results into negative, neutral, good, and excellent categories to help interpret whether employee sentiment is weak, stable, or strong. A company's enps provide context to decide if a score reflects risk or healthy engagement.
- Negative range (−100 to 0): Indicates more detractors than promoters. Negative scores signal significant disengagement and are associated with higher employee attrition. Low eNPS scores in this range are often linked to higher attrition risk and underlying issues such as poor career development or work-life balance, requiring urgent attention to improve employee experience and reduce turnover.
- Neutral range (0 to 10): Reflects a balanced mix of promoters and detractors. It indicates stable sentiment but limited advocacy, where employee experience is acceptable but not strong enough to drive positive word-of-mouth.
- Good range (10 to 30): Shows a higher proportion of promoters. A score in this range is considered good, suggesting employees are generally satisfied and willing to recommend the organization, though there is still room for improvement.
- Strong range (30 to 50): Indicates a strong eNPS score, with a clear majority of promoters. This range is above average and reflects healthy engagement and advocacy. For reference, smaller companies (0-250 employees) earn an average eNPS of 30, while larger organizations (5001+ employees) see their eNPS decrease to 9.
- Excellent range (50 to 70): Represents strong employee advocacy with minimal detractors. Organizations in this range typically have high trust and employee retention, strong culture alignment, and lower voluntary attrition compared to industry averages. A positive score here means more promoters than detractors, and scores above 50 are considered excellent.
- Exceptional range (above 70): Scores above 70, and especially above 80, are likely in the top percentages in almost any industry. Many tech companies achieve scores of 75 or higher, with the average eNPS benchmark for tech companies at 26.
A positive score overall means more promoters than detractors, which is a key indicator of healthy engagement. According to Hive HR's research, the overall eNPS benchmark for Q3 2024 reached 27.
What is considered a good eNPS score?
A good eNPS score typically falls between 30 and 50, but what is a good eNPS score depends on industry, company size, and organizational maturity. A score that is strong in one context may be average or weak in another.
Industry
eNPS scores vary by industry due to work conditions and expectations. Technology and professional services often report higher scores, while retail, healthcare, and BPO sectors tend to have lower averages due to workload intensity and operational pressure.
Company size
Smaller companies often report higher eNPS scores due to closer leadership access and faster decisions. Large enterprises usually see moderate scores because of organizational complexity and varied employee experiences across teams.
Organizational maturity
Mature organizations with stable processes and leadership tend to maintain consistent eNPS scores. Early-stage or scaling companies often show fluctuating scores due to changing structures, roles, and expectations.
A good eNPS score should always be evaluated relative to similar organizations. For detailed benchmarks, refer to the dedicated eNPS benchmark guide.
Why do eNPS scores vary across organizations?

eNPS scores vary across organizations because employee expectations, work conditions, and survey context differ widely. Company or workplace culture is a fundamental driver of employee sentiment and eNPS variation, shaping how employees perceive their work environment. A strong, positive company culture is essential for employee loyalty and engagement.
Additionally, understanding different employee populations and the employee value proposition can help organizations interpret eNPS results more accurately. The same score can indicate strong performance in one company and weak sentiment in another, making direct comparisons unreliable without context.
Industry
- A negative or positive work environment and job intensity influence responses. High-pressure sectors like BPO or healthcare often report lower eNPS than technology or consulting.
- Compensation models and career growth paths also shape employee perception and willingness to recommend.
Culture
- Organizations with transparent communication and strong leadership trust tend to report higher eNPS.
- Environments with limited feedback channels or low psychological safety often see more detractors.
Geography
- Regional work norms and economic conditions affect employee expectations.
- Employees in developed markets may rate more critically, while those in emerging markets may show higher tolerance under similar conditions.
Survey timing
- eNPS scores can shift based on when surveys are conducted.
- Periods like layoffs, restructuring, or peak workload cycles often result in lower scores, while stable periods reflect more balanced sentiment.
Organizational change
- Events such as leadership transitions, mergers, or policy shifts can impact employee sentiment quickly.
- During periods of uncertainty, employees often report lower trust and confidence, leading to temporary declines in eNPS scores.
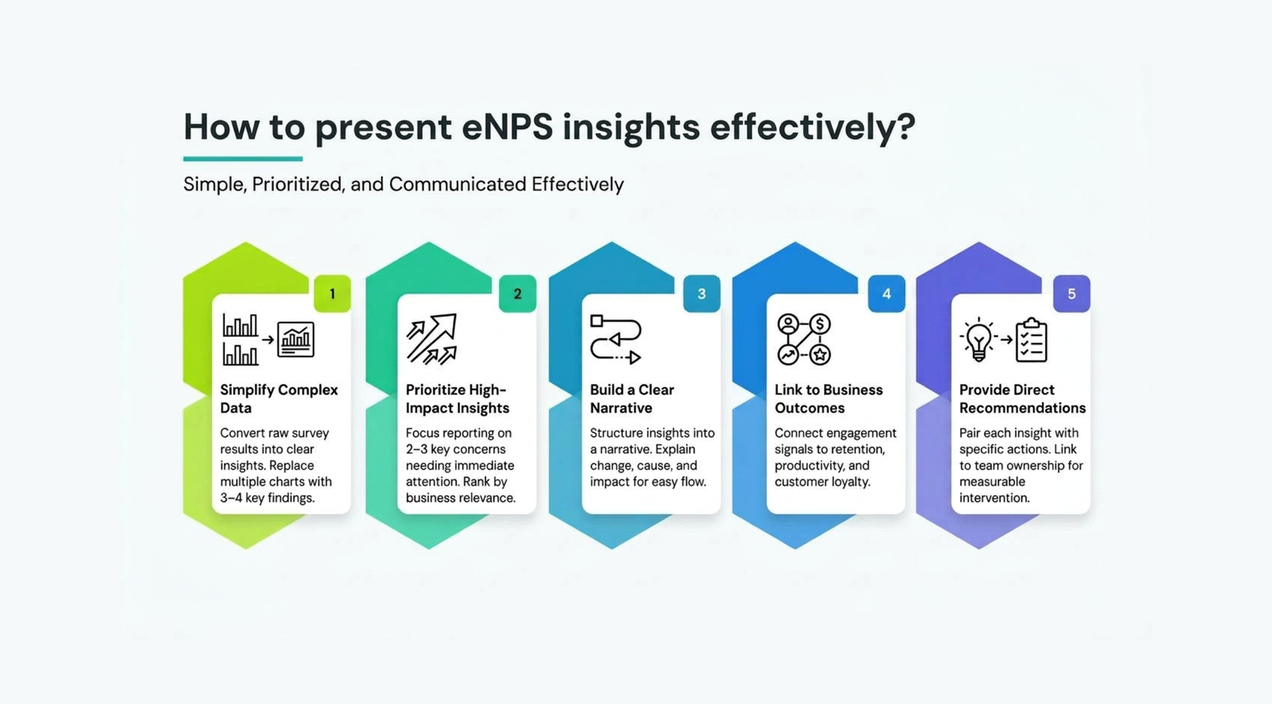
How should you interpret your eNPS score correctly?
To interpret the eNPS score correctly, focus on trends over time and evaluate results within context rather than relying on a single score. A standalone number does not explain whether employee sentiment is improving, stable, or declining.
- Trends over time provide direction: Tracking eNPS across cycles shows whether sentiment is improving or declining. A single score can be influenced by short-term events, while trends indicate sustained changes. Gallup reports that highly engaged employees achieve up to 18% higher productivity and 23% higher profitability, reinforcing the value of tracking engagement over time.
- Context defines whether a score is strong: The same score can have different meanings depending on company size, industry, and recent changes. Interpretation must consider internal conditions rather than relying on generic thresholds.
- Segment-level analysis reveals hidden issues: Overall scores often mask variations across teams or locations. Breaking eNPS data by department, tenure, team, or role helps identify specific areas of strength and weakness within the organization.
- Distribution of responses adds clarity: Understanding the proportion of promoters, passives, and detractors among employee responses provides deeper insight than the final score alone. Analyzing survey responses and employee responses helps identify areas for improvement and provides actionable insights. A stable score with rising detractors can indicate emerging risks.
- External comparison should be limited: Comparing eNPS across organizations without a similar context can be misleading. Differences in workforce structure and expectations make direct comparison less reliable for decision-making.
Communicating the results of eNPS surveys and the actions taken in response is crucial for building trust and encouraging future participation.
What are common mistakes when evaluating eNPS scores?

Common mistakes when evaluating eNPS scores include overreacting to single results, comparing scores without context, and ignoring segment-level insights. These errors reduce accuracy and can lead to incorrect decisions about employee experience and risk.
Treating eNPS as a standalone metric
To gain deeper insights, it's important to pair eNPS with qualitative feedback and other engagement metrics. Pairing eNPS with qualitative data, especially by following up with open-ended questions, helps uncover the reasons behind employee scores. This approach enables organizations to identify root causes of engagement issues and take more targeted actions.
Overreacting to a single score
Interpreting one survey result without trend data can mislead decision-making. Short-term events such as leadership changes or workload spikes can temporarily impact scores without indicating long-term sentiment shifts.
Comparing scores without context
Comparing eNPS across companies or industries without similar conditions creates false benchmarks. Differences in job roles, growth stage, and operating models make direct comparison unreliable.
Ignoring segment-level differences
Overall scores often hide variation across teams, locations, or tenure groups. Without segmentation, organizations may miss localized issues that require targeted action.
Focusing only on the final score
The final eNPS value does not reflect internal shifts between promoters, passives, and detractors. A stable score can still hide increasing dissatisfaction within specific groups.
Delaying action on feedback trends
Ignoring repeated declines across survey cycles reduces the value of eNPS tracking. Research by AllVoices finds that only about 38% of employees believe sharing critical feedback will lead to meaningful change, which lowers participation and trust if no visible action follows.
Treating eNPS as a standalone metric
Relying only on eNPS without supporting data limits interpretation. Combining it with attrition, performance, or engagement metrics provides a more accurate view of workforce sentiment.
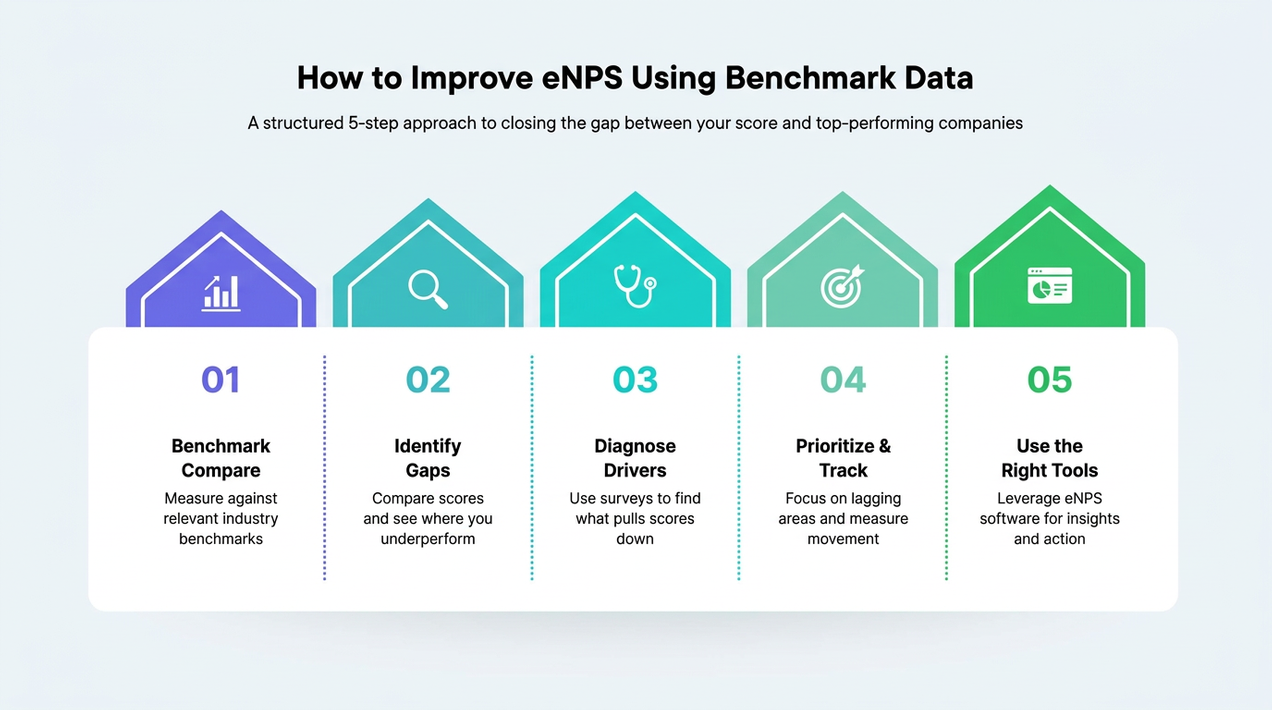
What should you do if your eNPS score is low?

If your eNPS score is low, focus on identifying root causes, validating trends, and taking targeted actions rather than reacting immediately. A low score signals underlying issues in employee experience that require structured follow-up. Recognition programs can significantly improve employee morale and loyalty, making them an important part of your strategy.
Take focused, measurable actions
- Analyze feedback to identify specific areas where you can improve employee engagement and improve employee satisfaction.
- Taking action on employee feedback builds trust and encourages future participation in surveys.
- Efforts to improve employee engagement and satisfaction can help address low eNPS scores and foster a more positive workplace culture.
Identify key drivers of dissatisfaction
- Analyze feedback to detect recurring issues such as workload, leadership gaps, or limited growth
- Prioritize themes that appear across multiple teams or survey cycles
Validate trends before acting
- Compare current scores with past cycles to confirm whether the decline is consistent
- Avoid making decisions based on a single survey result without trend validation
Segment data to locate problem areas
- Break down results by team, function, or tenure
- Focus on areas where detractor concentration is highest to guide targeted action
Communicate findings to employees
- Share key insights with employees to build transparency
- Clarify what issues are being addressed and what actions will follow
Take focused, measurable actions
- Implement small, targeted changes linked to specific issues
- Track whether actions lead to improvement in subsequent survey cycles
For detailed improvement strategies, refer to the dedicated eNPS improvement guide.
Conclusion
Understanding the eNPS score range is essential for interpreting employee sentiment accurately and making informed workplace decisions. A score alone does not reflect reality without context, trends, and segmentation. Organizations that measure eNPS consistently can identify areas of risk, improve company culture, and strengthen their employer brand over time.
CultureMonkey helps organizations go beyond surface-level scores by enabling continuous listening through pulse surveys, follow-up questions, and real-time insights. It helps gain valuable insights, uncover drivers behind sentiment, and drive meaningful change, ensuring employees feel valued while improving engagement, retention, and overall business outcomes consistently.
Book a demo with CultureMonkey
FAQs
1. What is a good eNPS score?
A good or acceptable score is usually a positive eNPS score, but context matters. It depends on industry, size, and maturity. eNPS focuses on employee voice and helps measure eNPS alongside business outcomes, ensuring employees feel valued and contribute to a positive culture.
2. Is a negative eNPS score bad?
A negative eNPS score means unhappy employees outnumber promoters, which may signal risk if employees leave. It is not always permanent, but requires constructive feedback through follow-up questions, pulse surveys, or focus groups to identify areas and drive meaningful change.
3. What is an excellent eNPS score?
An excellent score is typically 50 or above and reflects a strong employer brand, employee referrals, and a positive culture. It also links to positive customer experience and customer satisfaction, as employees respond with higher advocacy and engagement across the organization.
4. How do you calculate eNPS score?
To calculate eNPS, subtract the percentage of detractors from promoters. The enps question identifies loyalty, while passives are excluded. This method helps measure eNPS consistently and gain valuable insights into employee sentiment and overall workforce engagement trends.
5. Why do eNPS scores vary by industry?
eNPS scores vary due to workload, career advancement opportunities, and expectations. High-pressure sectors often have more unhappy employees, while others show stronger sentiment. These differences impact business outcomes, making it critical to interpret scores within the right context.
6. Should you compare eNPS across companies?
Comparing scores across companies can be misleading without a similar context. Differences in structure and culture impact results. Instead, use internal benchmarks, one-on-one meetings, and trend analysis to improve company culture and understand how employees respond over time.
7. How often should you track eNPS scores?
Most organizations use pulse surveys quarterly or monthly, depending on the pace of change. Regular tracking helps measure eNPS trends, gain valuable insights, and take timely action. Frequent listening ensures employees feel valued and improves responsiveness to workforce needs.
8. Can a high eNPS still be misleading?
Yes. A high score can hide issues if some teams are struggling. Without segment analysis, employees leave silently. Use follow-up questions, focus groups, and constructive feedback to identify areas, ensuring improvements lead to meaningful change and sustained engagement.


)