

How to present eNPS reporting to leadership?
eNPS reporting helps organizations convert employee sentiment into structured insights that leadership can act on. The employee net promoter score (eNPS) is a key metric for measuring employee engagement and satisfaction, providing a quick snapshot of workforce loyalty and advocacy.
This guide explains how to present eNPS results in a way that supports leadership decision-making. eNPS reporting provides valuable insights to improve company culture and employee engagement, while also helping track employee satisfaction as a key business outcome.


- eNPS reporting measures employee sentiment by structuring scores, trends, and feedback into leadership-ready insights.
- Converts raw survey data into clear signals on engagement drivers, risks, and workforce stability.
- Focuses on trends, key drivers, and high-risk segments instead of isolated scores for better decisions.
- Effective reports prioritize clarity, actionability, and ownership to ensure insights lead to measurable outcomes.
- CultureMonkey structures eNPS reporting into actionable insights, enabling leadership to track, act, and improve engagement consistently.
Why eNPS reporting matters for leadership?

eNPS reporting matters because leadership needs structured, decision-ready insight instead of standalone engagement scores. It converts employee feedback into clear indicators of workforce stability, retention risk, and performance gaps, helping leaders make timely and informed decisions.
- Translates employee sentiment into actionable insight: Converts raw scores into clear signals on engagement drivers and dissatisfaction areas, helping leaders understand what is influencing employee sentiment.
- Identifies retention and attrition risks early: Highlights declining promoter scores and rising detractors, which often indicate increasing dissatisfaction and can signal potential voluntary exits before they impact workforce stability.
- Provides visibility into workforce stability: Shows where morale, trust, or engagement is weakening across teams, allowing leadership to detect patterns that may affect performance and team consistency.
- Links engagement with business performance: Connects employee sentiment with productivity, customer experience, and operational outcomes.
- Prioritizes critical workforce issues: Helps leaders focus on the most impactful problems by filtering out low-priority feedback and highlighting areas that require immediate attention.
- Supports accountability across leadership layers: Enables managers and business leaders to take ownership of engagement outcomes within their teams, ensuring that insights are translated into measurable actions.
- Enables benchmarking and comparison: Uses eNPS data and eNPS benchmarks to compare engagement levels and net promoter scores across teams, departments, and industries, helping organizations track trends and identify areas for improvement.
What leaders expect from eNPS reports?
Leaders expect eNPS reports to provide clear, focused insights that help them understand what is happening within the workforce and where attention is required.
Reports should clearly present the final score and segment employee responses as Promoters, Detractors, and Passives, to offer deeper insight into employee advocacy and engagement.
1. Clarity in insights
- Present scores with clear comparison, including current score, previous cycle, and change, to help leaders quickly assess performance
- Include the exact eNPS question in reports so leaders know what is being measured and can better interpret employee engagement and loyalty results
- Explain the meaning behind the score so leaders understand its impact on morale, retention, and workforce stability
- Remove unnecessary data and focus only on insights that directly support decision-making
2. Visibility into changes
- Show how engagement is shifting across cycles by using recent data to indicate whether sentiment is improving or declining
- Highlight differences across teams, functions, or locations to uncover localized issues
- Support pattern recognition by identifying recurring themes across multiple survey cycles
3. Identification of workforce risks
- Highlight areas with declining engagement to signal potential workforce concerns, including risks to employee retention
- Connect feedback to outcomes such as attrition, burnout, or performance decline
- Surface high-risk teams so leadership can prioritize immediate intervention
4. Clear action direction
- Provide specific recommendations that translate insights into practical steps
- Align actions with business priorities such as retention, productivity, or stability
- Ensure each insight is linked to ownership, next steps for execution, and is connected to an ongoing improvement process
5. Executive-level usability
- Keep reports concise and easy to scan so leaders can review them quickly, helping to minimize survey fatigue among staff
- Use consistent formats across reporting cycles to support comparison and tracking
- Example: “eNPS dropped from +22 to +14 due to workload issues in support teams,” clearly showing change, cause, and focus area
How to structure an eNPS report?

An effective eNPS report format organizes feedback into clearly defined sections that explain current performance, highlight underlying causes, and guide leadership decisions.
This structure is based on data collected from employee NPS surveys and Net Promoter Score surveys, including NPS surveys used throughout the employee lifecycle.
1. Score summary
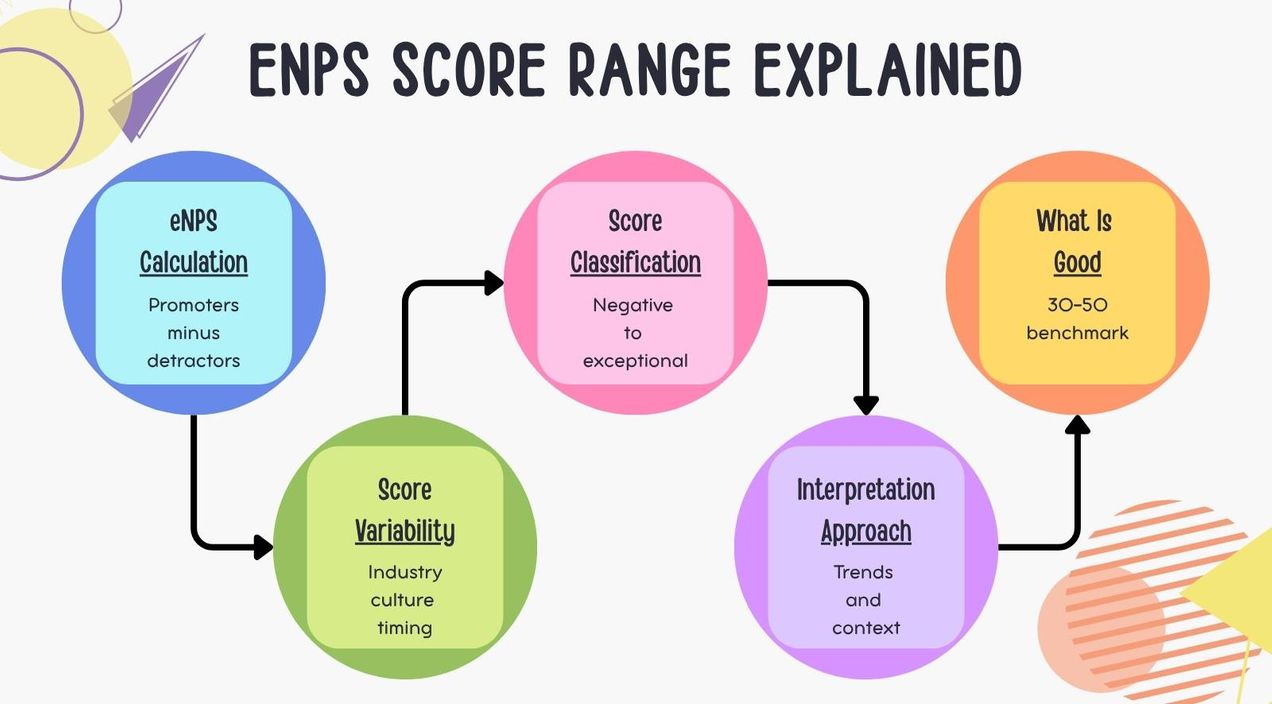
This section presents the current eNPS score with essential context so leaders can interpret it immediately. The eNPS calculation is straightforward: employees are grouped as promoters, passives, or detractors based on their survey responses. To calculate eNPS, subtract the percentage of detractors from the percentage of promoters.
Example: “eNPS: +18, up from +10 last quarter, above industry average of +12.”
2. Performance movement
Use this section to track trends in engagement over time. This section shows how the eNPS score has changed over multiple cycles to indicate direction and consistency. Instead of a single data point, it highlights whether engagement is improving, declining, or remaining stable.
Example: “+25 → +20 → +18 over three cycles indicates gradual decline.”
3. Key drivers of employee engagement and eNPS
This section explains the main factors influencing employee sentiment, focusing only on the most impactful drivers such as employee advocacy and the proportion of satisfied employees. It helps leadership understand what is causing changes in the score.
Example: “Low manager support and workload imbalance are driving dissatisfaction in sales teams.”
4. Workforce risk signals
A negative score in eNPS reporting or declining employee morale can signal significant business risks. This section highlights areas where engagement patterns may lead to business risks such as burnout, or performance issues. It connects survey results with potential outcomes.
Example: “Customer support shows rising dissatisfaction along with increased attrition over two cycles.”
5. Recommended actions
This section translates insights into specific, practical steps that leadership can act on, recommending actions that help improve eNPS and use eNPS effectively by offering a quick and effective way to measure employee engagement and commitment. Actions should be directly linked to identified issues and aligned with business priorities.
Example: “Rebalance workload and introduce manager coaching in low-scoring teams.”
6. Executive summary view
This section provides a concise overview of the most important insights across all sections. It helps leaders quickly grasp key issues without reviewing the full report.
Example: “Decline in eNPS driven by workload issues in support teams, increasing attrition risk. The final score for this period is 28, which is considered a good eNPS score based on industry benchmarks.”
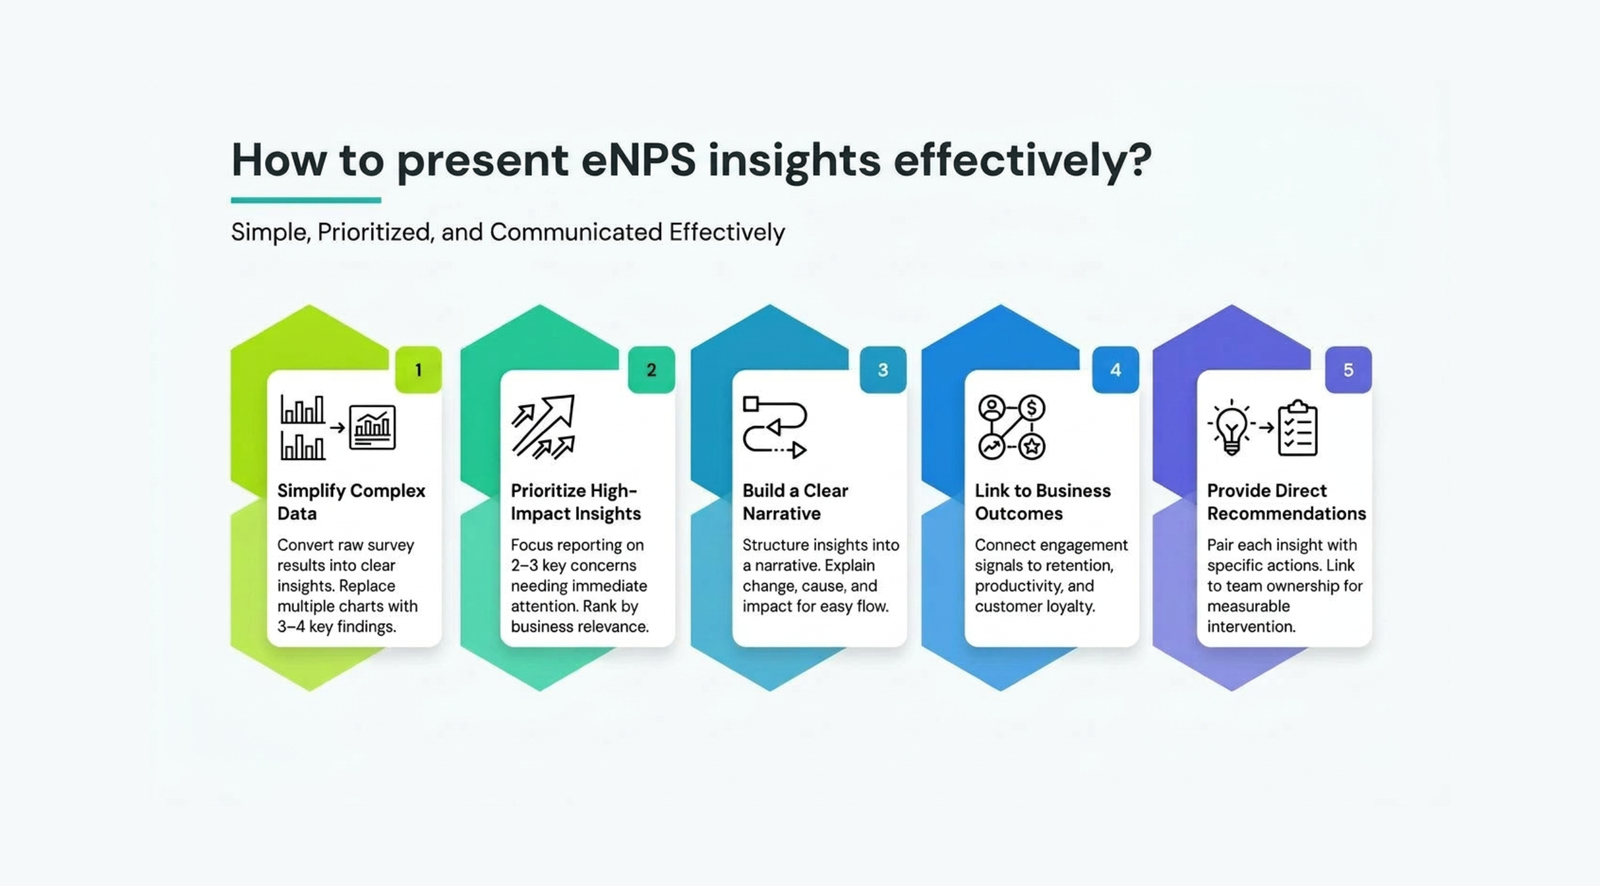
How to present eNPS insights effectively?
eNPS insights are effective when they are simplified, prioritized, and communicated in a structured way that helps leadership quickly interpret key messages. When you collect feedback through eNPS surveys, including open-ended follow-up questions allows you to gain valuable insights into the reasons behind employee scores.
Simplify complex data
- Convert survey results, including eNPS and other surveys, into clear insights instead of detailed datasets so leaders can quickly understand the situation
- Replace multiple charts with 3–4 key findings that summarize overall employee sentiment
- Use plain, business-focused language to explain what the score means for workforce stability and performance
Prioritize high-impact insights
- Focus on the most critical issues by limiting reporting to 2–3 key concerns that need immediate attention, prioritizing the most significant engagement results
- Rank insights based on business relevance, such as retention, productivity, or team performance impact
- Indicate urgency clearly so leadership understands where intervention is required first
Build a clear narrative
- Structure insights as a simple narrative that explains change, cause, and impact so leaders can follow the logic easily, including how employees feel about changes in engagement.
- Present insights in a logical flow, explaining what changed and what is driving that change
- Example: “eNPS dropped due to workload concerns in sales, impacting team stability”
Link insights to business outcomes
- Connect engagement signals with operational impact, such as retention, performance, or customer experience.
- Employee engagement can directly influence customer satisfaction, customer loyalty, and perceptions of the company's products.
- Organizations often measure customer satisfaction alongside eNPS reporting to gain a comprehensive view of both employee and customer perspectives.
- Highlight measurable implications like increased attrition or service delays linked to low engagement
- Focus on outcomes that require leadership attention and decision-making
Use visual summaries for quick interpretation
- Present key findings using simple formats such as summary tables or concise visual views, highlighting results by different groups for clearer interpretation
- Avoid overloading dashboards with too many metrics or breakdowns
- Structure insights so leaders can interpret them within minutes
Provide clear and direct recommendations
- Pair each insight with a specific action so leaders know what needs to be done next
- Focus on measurable interventions instead of general suggestions
- Ensure actions are linked to team-level ownership for execution
Maintain consistency across reporting cycles
- Use the same structure in every report to enable easier comparison
- Keep metrics and definitions consistent across cycles
- Support continuous evaluation so leadership can track progress over time, and use consistent reporting to monitor when high eNPS is achieved and sustained.
(Source: CultureMonkey)
What are common mistakes in eNPS reporting?

Common mistakes in eNPS reporting occur when reports lack clarity, context, and actionability. This limits leadership’s ability to interpret insights and make timely decisions, reducing reports to static data instead of decision-support tools.
- Presenting too much data without prioritization: Reports often include excessive charts, metrics, and breakdowns without highlighting key insights, making it difficult for leaders to focus on what requires immediate attention.
- Sharing scores without business context: Reporting an eNPS score without explaining drivers or impact creates confusion, as leaders cannot understand what is causing changes or what it means for retention and performance.
- Missing clear action recommendations: Reports that present insights without defined next steps fail to drive execution, leaving leadership without direction on how to respond.
- Failing to highlight movement across cycles: Focusing only on current scores prevents leaders from understanding whether engagement is improving or declining over time.
- Not identifying key drivers: Listing multiple factors without prioritization makes it difficult to act, as leadership needs clarity on the most impactful causes.
- Misclassifying passives: A common mistake is misclassifying passives, who are generally satisfied employees. While they are content and may recommend the organization, they do so with less enthusiasm than promoters and should not be overlooked in analysis.
- Failing to consider other factors: Not accounting for other factors such as company size, industry, culture, or unique organizational circumstances can lead to misinterpretation of eNPS results and inaccurate benchmarking.
- Ignoring high-risk segments: Aggregated data can hide issues in specific teams or functions, leading to missed early warning signs.
- Lack of ownership and accountability: Without assigning responsibility, insights are less likely to translate into action across teams.
- Overcomplicating presentation formats: Complex dashboards or technical language reduce accessibility and slow down decision-making.
How do you turn eNPS reports into leadership action?
eNPS reports turn into leadership action when insights are tied to clear ownership, defined timelines, and measurable outcomes. Leaders must execute actions, tracking progress, and validating whether interventions are improving engagement and workforce stability.
- Assign clear ownership for each issue: Ensure every key insight is mapped to a specific leader or manager responsible for taking action within their team. HR asks employees for feedback through eNPS surveys, ensuring employee input is considered in the action planning process.
- Define specific actions linked to insights: Translate findings into practical steps, such as improving manager communication or addressing workload imbalance.
- Establish follow-up mechanisms: Review progress in the next reporting cycle to ensure actions are implemented and not delayed.
- Track performance and engagement metrics: Monitor eNPS scores, driver questions, and related indicators like attrition or productivity to evaluate impact.
- Validate effectiveness of interventions: Assess whether actions have improved scores or resolved underlying issues, and refine approach if needed.
- Maintain a consistent review cadence: Align follow-ups with survey cycles so leadership can continuously evaluate progress and adjust actions accordingly, with the goal of maintaining a positive work environment.
Companies that act on regular employee feedback see around 14.9% lower turnover rates, reinforcing the importance of converting insights into consistent action.
What is a sample eNPS reporting format (outline)?

A sample eNPS reporting format provides a simple, structured outline that helps leadership quickly review key insights in a consistent and decision-focused format.
Score Summary:
- eNPS stands for Employee Net Promoter Score. eNPS measures how likely employees are to recommend your organization as a place to work, providing insight into employee engagement and satisfaction.
- The eNPS score is calculated by subtracting the percentage of Detractors from the percentage of Promoters, based on responses to the recommendation question.
Key Insights:
- Track employee loyalty and the proportion of happy employees by monitoring eNPS trends and analyzing the distribution of Promoters, Passives, and Detractors.
- Identify areas for improvement and celebrate departments or teams with high engagement.
Executive summary:
- eNPS score with change from last cycle, including reporting the company's eNPS and noting when higher eNPS scores are achieved
- Example: “eNPS: +15, down from +22 last quarter” or “eNPS: +30, up from +22 last quarter, indicating higher eNPS scores and improved organizational health”
- 2–3 key insights summarizing major changes across teams
- Top priority action areas that require immediate leadership attention
Score breakdown:
- Promoters, passives, and detractors distribution based on employee NPS (Net Promoter Score)
- Example: “Promoters (employees who are highly likely to recommend the organization): 42%, Passives (neutral employees): 30%, Detractors (employees who are unlikely to recommend the organization): 28%”
- Comparison with the previous cycle to identify shifts in employee sentiment
Trend view:
- Last 3–4 cycle movement to show whether engagement is improving or declining
- Example: “+25 → +22 → +18 → +15”
- Key teams or functions contributing most to the change in scores
Key drivers:
- Top 2–3 influencing factors affecting employee sentiment across teams
- Example: “Workload pressure and manager support issues in operations”
- Supporting signals from survey responses to validate these drivers
Risk flags:
- Teams or segments with declining scores that may impact workforce stability
- Example: “Customer support showing rising dissatisfaction and exit risk”
- Potential business impact, such as attrition, performance decline, or morale issues
Action plan:
- Defined actions linked directly to identified issues for clear execution
- Example: “Workload redistribution and manager coaching in low-scoring teams”
- Assigned owners and timelines to ensure accountability and follow-through
Follow-up:
- Next review cycle to track whether actions have been implemented
- Example: “Review in next monthly survey cycle”
- Metrics to track improvement, such as score changes, driver recovery, or attrition trends
Conclusion
eNPS reports are effective only when they drive decisions rather than just presenting data. Leadership needs clear, structured insights that highlight trends, risks, and actions without unnecessary complexity. When reports focus on clarity over volume, they enable faster decisions, better prioritization, and timely interventions across teams.
CultureMonkey supports this approach by organizing feedback into actionable insights, trend visibility, and structured reporting formats. This helps leadership move from reviewing scores to taking consistent action, ensuring employee feedback contributes directly to workforce stability and business outcomes.
Book a demo with CultureMonkey.
FAQS
1. How do you present eNPS results to leadership?
Present eNPS results with a short executive summary, score movement, main drivers, key risks, and recommended actions. Keep the language simple, compare with the last cycle or benchmark, and show only the most important team-level patterns so leaders can act quickly and avoid overload.
2. What should an eNPS report include?
Include a score summary, trend view, key drivers, risk flags, and next steps. Add cycle comparisons and segment results by team or location so leaders can read the report in order and understand the issue without going through raw data or unnecessary detail.
3. How often should eNPS be reported?
Report eNPS monthly or quarterly, based on how fast conditions change. Fast-moving or high-pressure teams need shorter cycles, while stable functions can use quarterly reviews. Consistent timing helps leadership compare results properly and see whether actions are improving engagement over time.
4. Who should see eNPS reports?
HR, executive leaders, managers, and relevant risk or compliance partners should see eNPS reports. Broad sharing builds ownership, but access should still match responsibility. Leaders need summaries, while managers need team-level insights they can use to take action within their own areas.
5. How do you explain low eNPS to leadership?
Explain low eNPS with context, not apology. Show what changed, which teams are affected, and which drivers are behind the score. Then connect the result to action, such as workload changes, manager support, or communication fixes, so leadership sees a path forward rather than only a problem.
6. What insights matter most to executives?
Executives focus on the direction of change and high-risk areas that impact business outcomes. They want to understand whether engagement is improving or declining, where attention is needed most, and how it may affect retention or performance, so they can prioritize decisions without reviewing unnecessary detail.
7. How detailed should eNPS reports be?
eNPS reports should begin with a concise summary and then allow deeper detail if needed. Leaders want the main takeaway first, followed by supporting charts or segment data for context. This keeps the report clear, scannable, and useful for follow-up discussions in meetings.
8. How do reports drive action?
Reports drive action when each insight has an owner, a deadline, and a follow-up check. Leadership should review progress in the next cycle, confirm what changed, and adjust the response if needed. This keeps feedback tied to accountability instead of leaving it as static data.


