

Employee feedback tool statistics & benchmarks 2026: Trends and predictive insights
Most organizations collect employee feedback. Fewer truly understand what the numbers are telling them. A participation rate alone does not indicate trust. An engagement score alone does not reveal momentum. What matters is the pattern behind the data: which drivers are growing, which are stagnating, and which actually translate into measurable engagement lift over time.
Employee feedback in 2026 is no longer about the volume of responses. They are about structural leverage. Participation rates, growth differentials, predictive drivers, and longitudinal benchmarks now guide executive decisions. Leaders who understand these statistics prioritize smarter. Those who ignore them often invest heavily without seeing sustained movement.


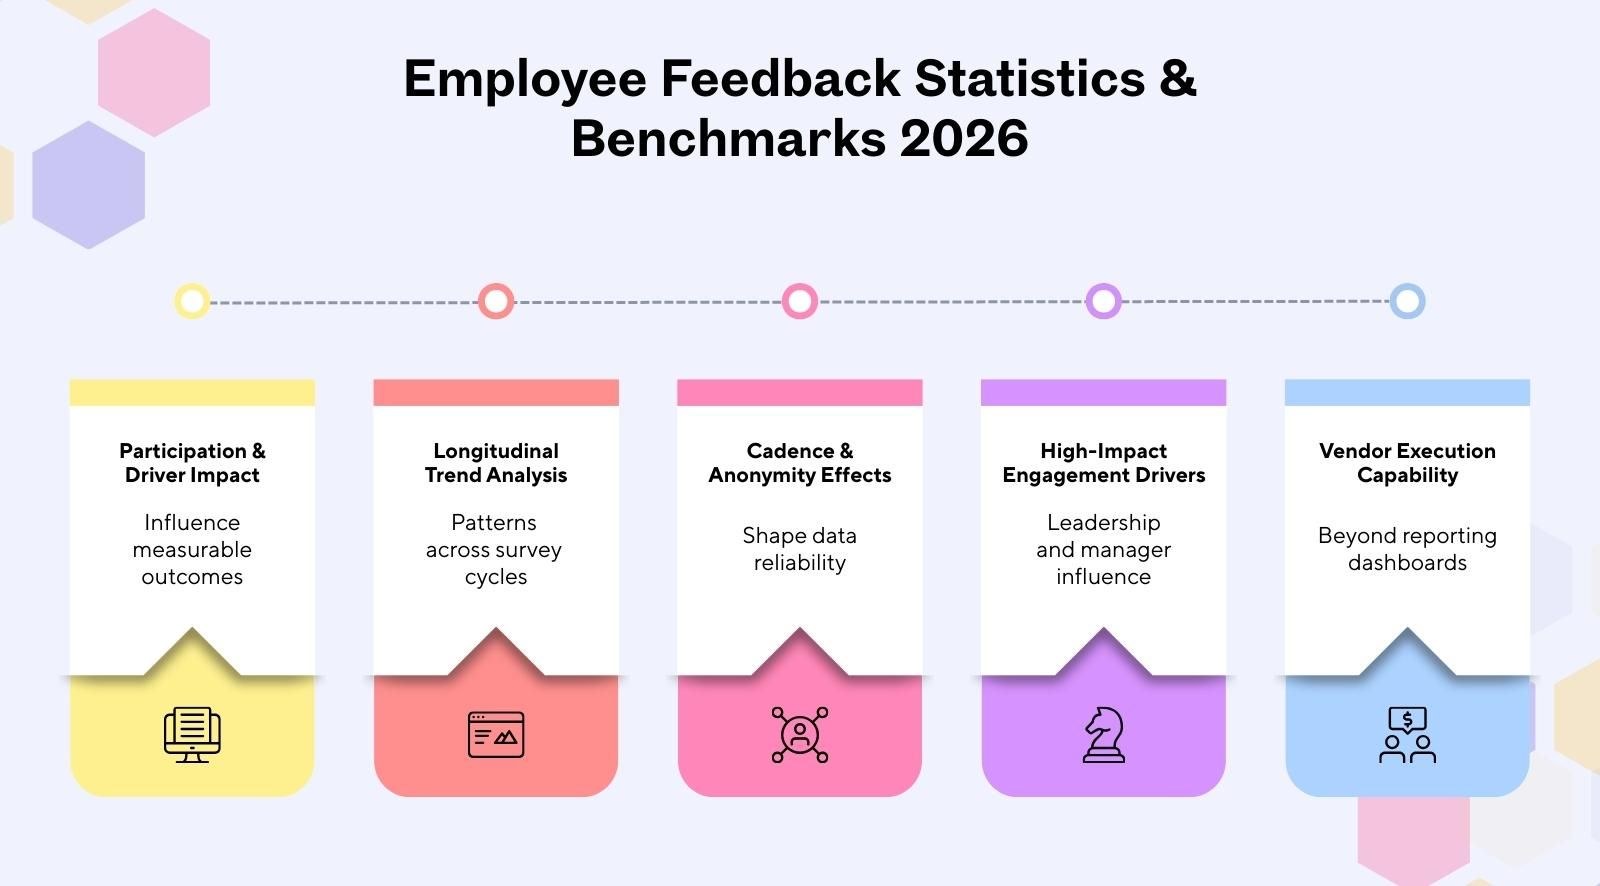
- Employee feedback statistics explain how participation and drivers influence measurable engagement outcomes.
- Longitudinal analysis identifies structural patterns beyond single survey cycles.
- Structured pulse cadence and anonymity settings shape engagement survey reliability.
- Leadership, involvement, and manager support show the strongest engagement growth impact.
- Vendor selection should prioritize execution capability, not just reporting dashboards.
Key employee feedback statistics for 2026
Employee engagement statistics are like a system health report for workplace culture. When patterns shift, business outcomes shift. Engagement surveys reveal movement beneath employee sentiment, not just surface survey results. These employee feedback benchmarks highlight where employee experience gains truly originate.
- Average global participation rate: Across longitudinal cycles, participation stability appears more strongly associated with cadence consistency, clarity of purpose, and anonymity configuration than with incentive-based approaches. While participation levels vary by organization and workforce structure, predictable and clearly communicated survey programs tend to show steadier response patterns over time.
- Engagement lift from structured pulse cadence: Consistent pulse survey benchmarks create rhythm in engagement surveys. When HR leaders maintain cadence and follow through, employee engagement metrics show steadier improvement and more reliable survey results.
- Participation stability under defined anonymity thresholds: Organizations using clearly communicated minimum reporting thresholds (for example, N ≥ 5 responses before team-level reporting) tend to demonstrate more stable response behavior across cycles. While this does not establish causality, consistent privacy safeguards appear directionally associated with higher perceived psychological safety and response reliability.
- Participation differences between remote and on-site teams: Access and digital familiarity influence participation rates. Participation behavior varies across remote, onsite, and hybrid environments. Distributed teams may experience fewer logistical barriers to digital survey access, while shift-based onsite teams may face structural timing constraints. These patterns are observational within the dataset and should be interpreted contextually rather than as universal participation benchmarks.
- Top 5 predictive engagement drivers: Engagement growth is structurally concentrated; only 4–5 drivers produce disproportionate lift. Involvement (+1.51%) and Leadership (+1.50%) lead, while Recognition (-0.09%) and Wellness (-0.74%) stagnate. A +0.20 driver movement correlates with +0.05 to +0.07 lift, representing 25–35% proportional translation into overall engagement growth.
About the dataset and methodology

Methodology determines whether employee feedback statistics are reliable. HR professionals trust engagement survey data analysis only when inputs are structured and bias is controlled. This section explains how the dataset was built and validated to support credible employee listening while reducing survey fatigue in future surveys.
- Total responses analyzed: CultureMonkey analyzed 10M+ anonymized responses to reduce one-off noise and strengthen employee survey analytics. Bigger samples steady participation rates, so employee engagement metrics reflect engagement trends rather than a single loud moment in survey results.
- Number of organizations: Responses were aggregated across many organizations, so employee experience trends are not shaped by one employer’s policies. This lets HR professionals compare engagement trends and still pull actionable insights that support steadier job satisfaction over time.
- Industry distribution: We included multiple industries to avoid overfitting engagement trends to one operating model. Broader coverage helps employee feedback reflect employee experience trends, and it helps HR professionals interpret employee engagement trends in 2026 without blaming tools alone.
- Geographic spread: Data spans regions with different norms and reporting comfort, so employees feel safer to answer honestly. This reduces distortions in survey response rate statistics and helps assure employees that employee listening captures reality, not only one location.
- Time frame: We used longitudinal cycles instead of a single window to track engagement trends over time. This improves engagement survey data analysis by showing whether changes stick, and it reduces overreactions to short-term spikes in employee feedback.
- Data cleaning and bias controls: We removed duplicates, filtered spam-like entries, and suppressed segments to protect privacy and limit survey fatigue. These controls help assure employees, strengthen employee listening, and produce actionable insights HR professionals can trust for future surveys.
- Statistical modeling approach: We used driver-level aggregation and differential comparisons to find signals that predict movement, not just popularity. This strengthens employee engagement metrics for decision-making, while keeping conclusions directional, so HR professionals can act without overstating cause.
Adoption trends in employee feedback tools
Adoption trends in employee feedback tools show how organizations improve survey design and act on employee feedback data insights. As response rates strengthen and employee listening becomes consistent, workforce engagement statistics reveal clearer participation patterns and more stable engagement signals across industries.
- Growth in pulse survey adoption: Pulse surveys have expanded as organizations move away from longer surveys toward shorter pulse surveys that fit busy schedules. Across 10M+ anonymized responses on a five-point engagement scale, longitudinal driver-level aggregation shows steadier response rates when surveys are predictable and clearly linked to company culture improvements.
- Increase in always-on feedback channels: Always-on channels, including focus groups and continuous employee listening, complement pulse surveys by capturing honest responses between cycles. Cross-industry averaging and removal of noise categories indicate that organizations using blended methods generate more stable employee feedback data insights over multiple survey cycles.
- AI feature adoption rates: AI tools are increasingly embedded into survey design to surface patterns faster and provide valuable insights. Differential comparisons between higher-growth and plateauing organizations suggest that programs with stronger driver-level prioritization capabilities demonstrate clearer structural alignment.
- Industry-specific tool maturity: Adoption maturity varies by sector, yet growth % analysis across multiple survey cycles shows similar structural patterns. Organizations that connect feedback to career growth discussions and team meetings create clearer links between employee listening and measurable company culture progress.
Pulse survey cadence vs engagement outcomes

Pulse survey cadence influences how consistently employees respond and how clearly engagement shifts can be measured. When the HR team aligns timing with employee capacity, input leads to action. The table below shows how cadence patterns affect higher engagement and work-life balance outcomes.
The impact of anonymity controls on participation
Anonymity controls directly influence participation and data quality. When employees doubt privacy protections, low response rates follow, and survey results fail to reflect employee needs. Clear communication about how data is protected increases trust, ensures voices matter, and helps leaders give important issues immediate attention.
- Participation by anonymity threshold: Larger organizations often need clear criteria for when reports appear at team levels. When anonymity rules are consistent, employee sentiment statistics become a strong indication of real patterns. Vague settings increase doubt and reduce participation, even when questions match employee needs.
- Small-team suppression effects: Suppression protects privacy in small groups, but it can hide pockets of risk if used too aggressively. Clear communication helps teams understand why some cuts are not shown. Without that, employees assume filtering is selective, which drives low response rates.
- Anonymous vs confidential response rates: Anonymous setups typically produce more honest signals when topics touch career goals or manager behavior. Confidential models can work, but only with clear priorities and trust. The best approach depends on how quickly leaders turn feedback into immediate attention and action.
- Psychological safety correlation: When employees see clear criteria, steady follow-through, and consistent privacy safeguards, psychological safety rises. That supports engagement driver analysis and strengthens engagement growth benchmarks because people share what they usually withhold. Without safety, survey data skews positive and misses risk early.
Remote vs onsite feedback participation
Remote and onsite feedback participation varies based on access, schedules, and communication norms within an organization. When work location changes, response behavior shifts due to time zones and team routines. These differences affect data quality and influence decision-making across distributed, hybrid, and centralized teams.
Most predictive drivers of employee engagement in 2026
Predictive drivers identify which factors influence engagement before outcomes change. When organizations focus on the right variables, employee survey performance metrics become actionable. The ranked drivers below are based on employee feedback tool benchmarks by industry and show where engagement growth consistently concentrates.
- Involvement (+1.51%): Involvement shows the highest growth weight across cycles. When employees influence decisions, employee survey performance metrics improve consistently. This driver anchors engagement lift more strongly than most visible initiatives.
- Leadership (+1.50%): Leadership clarity closely follows involvement in predictive strength. Clear direction and trust create measurable separation across employee feedback tool benchmarks by industry. The gap between top and bottom drivers reaches 2.25 percentage points.
- Meaningful work (+1.47%): Meaningful work acts as a purpose multiplier within engagement scoring models. When roles feel connected to outcomes, employee survey performance metrics show sustained movement rather than short-term spikes.
- Engagement index (+1.45%): The engagement index validates structural alignment across drivers. It reflects composite movement and strengthens interpretation beyond the average employee survey participation rate in 2026.
- Manager support (+1.30%): Manager support influences day-to-day experience and reinforces structural drivers. High-performing groups consistently outperform lower bands in employee feedback tool benchmarks by industry.
- Recognition (-0.09%) and wellness (-0.74%): Recognition and wellness show limited independent lift. Despite attention in programs, they rank lower in predictive scoring and contribute less to long-term engagement variance.
Engagement benchmarks by industry

Industry benchmarks compare engagement patterns across sectors with different workforce pressures. Healthcare, manufacturing, technology, and retail operate under distinct constraints. Cross-industry averaging highlights differences in survey responses and helps managers focus on drivers that strengthen engagement and improve productivity.
- Healthcare: Healthcare organizations often report strong mission alignment but face fatigue-driven participation gaps. Cross-industry averaging shows engagement growth is unevenly distributed, requiring managers to prioritize structural drivers to maintain engaged teams and stabilize survey responses in high-pressure environments.
- Manufacturing: Manufacturing teams may achieve the highest response rates when surveys are mobile-enabled and shift-friendly. However, the 2.25 percentage points gap between the highest and lowest growth drivers signals structural leverage, not marginal difference, shaping productivity outcomes.
- Financial services: Financial services firms often demonstrate consistent survey responses but experience variance in engagement growth concentration. The dataset shows engagement growth is unevenly distributed, reinforcing that managers must focus on high-leverage drivers to sustain engaged performance.
- Technology: Technology organizations frequently show strong engagement scores, yet variance persists beneath averages. The 2.25 percentage points spread between Involvement (+1.51%) and Wellness (-0.74%) highlights structural leverage within industry engagement benchmarks.
- Retail: Retail environments balance customer intensity with workforce scale, influencing responses across locations. Cross-industry averaging indicates that engagement concentration patterns hold across sectors, guiding managers toward drivers that impact productivity more than surface-level initiatives.
AI analytics vs traditional reporting: what the data shows

AI analytics enhances how engagement data is analyzed compared to traditional reporting. Dashboards summarize past surveys, while predictive analytics in employee engagement surveys detect patterns earlier. This difference affects how quickly leaders identify risk, prioritize drivers, and respond to engagement shifts.
What these statistics mean for HR leaders and buyers
Engagement data only creates impact when translated into clear decisions. When HR teams measure employee engagement without prioritization, effort spreads thin, and results stall. The insights below convert structural multipliers and tactical stabilizers into focused actions that strengthen employee satisfaction and support engaged employees.
- Optimal survey cadence: Choose a cadence that reinforces structural multipliers rather than over-measuring tactical stabilizers. Observed proportional alignment in the dataset ranges directionally around 25–35%, though this should be interpreted as a prioritization heuristic rather than a guaranteed conversion ratio.
- Minimum anonymity configuration: Protect privacy with clear thresholds so feedback remains credible and participation stable. Strong anonymity settings reinforce structural multipliers and reduce distortion across teams. When employees trust safeguards, employee satisfaction improves, and leaders receive clearer signals.
- AI readiness: Evaluate whether tools surface structural multipliers instead of amplifying tactical stabilizers. Advanced analytics highlight the 2.25 percentage points variance between high and low leverage drivers. This clarity helps HR leaders prioritize decisions that sustain engaged employees.
- Benchmark comparison guidance: Compare results against industry baselines to identify structural gaps rather than cosmetic differences. Cross-industry analysis shows engagement is unevenly distributed, so interpretation must focus on leverage. Leaders who benchmark correctly avoid misreading employee satisfaction trends.
- When to upgrade from basic tools: Upgrade when reporting cannot distinguish structural multipliers from tactical stabilizers. Basic dashboards summarize sentiment but lack driver prioritization. Organizations ready for sustained growth require systems that convert feedback into structured action.
Limitations of the dataset
Limitations are like guardrails for decision-making; they prevent over-reading the numbers. Even with 10M+ anonymized responses, patterns can shift by context and measurement design. Since this dataset uses a five-point engagement scale and growth % analysis across multiple survey cycles, it is important to interpret results carefully.
- Sampling bias: The dataset reflects organizations actively running surveys, which may differ from those not consistently. Even with 10M+ anonymized responses, results can lean toward more mature programs. Treat outputs as directional benchmarks, not universal truths.
- Industry distribution skew: Cross-industry representation may not be perfectly balanced, affecting comparisons. A five-point engagement scale improves consistency, but sector-specific norms can shape how respondents score. Use findings as context, then validate against your own internal baselines.
- Model assumptions: Growth % analysis across multiple survey cycles relies on assumptions about stability and reporting cadence. These assumptions help compare movement, yet they cannot capture every org-level change. Interpret driver movement as a signal, not a complete causal explanation.
- Interpretation caution: Growth percentages represent average movement across reporting cycles and are directional, not causal guarantees. Use the results to guide prioritization, then test interventions locally before scaling decisions across teams.
Conclusion
Employee feedback tool statistics are no longer just reference numbers; they shape how organizations prioritize action, allocate resources, and measure real progress. In the workplace, understanding participation patterns, structural drivers, and engagement concentration helps leaders move beyond surface-level sentiment.
Data-backed directional insights help organizations identify where effort appears more strongly associated with engagement movement and where initiatives demonstrate lower relative leverage. When interpreted within methodological constraints, these patterns can support more disciplined prioritization.
CultureMonkey, an employee feedback tool, supports this shift by combining structured feedback programs with driver-level analytics and actionable workflows. Instead of only reporting sentiment, the platform helps organizations identify structural multipliers, activate managers, and convert insights into measurable engagement lift.
Book a demo with CultureMonkey.
FAQs
1. What are the latest employee feedback tool statistics for 2026?
Employee feedback tool statistics 2026 highlight shifts in participation patterns and predictive analytics adoption. They reflect how organizations structure cadence and anonymity. These statistics help leaders benchmark performance and identify structural multipliers influencing measurable engagement outcomes.
2. What is the average participation rate in employee surveys?
The average participation rate in employee surveys varies by cadence, anonymity configuration, and workforce type. Structured pulse programs typically see higher participation than annual surveys. Rates improve when organizations communicate purpose clearly, close feedback loops consistently, and demonstrate visible action based on survey results.
3. How often should companies run pulse surveys for maximum engagement?
Companies should run pulse surveys at a cadence that balances insight depth and survey fatigue. Monthly or quarterly cycles are common, depending on workforce stability and change velocity. The optimal frequency supports measurable engagement lift without overwhelming employees or reducing response quality.
4. Do anonymity thresholds increase survey participation rates?
Anonymity thresholds can increase survey participation rates when clearly communicated and consistently enforced. Employees are more likely to respond when privacy protections are transparent. Strong configuration controls, suppression rules, and minimum response counts strengthen trust and encourage candid participation.
5. What are the top drivers of employee engagement in 2026?
Top drivers of employee engagement in 2026 include involvement, leadership quality, meaningful work, and manager support. Driver-level analysis shows structural impact when these areas improve. Organizations that prioritize high-impact drivers see stronger engagement index movement over reporting cycles.
6. How do remote and onsite teams compare in participation rates?
Remote and onsite participation rates differ based on access, communication rhythm, and local culture. Remote teams often respond well to digital-first pulse surveys, while onsite teams benefit from integrated communication touchpoints. Context and segmentation determine measurable participation gaps.
7. Which industries report the highest engagement benchmarks?
Engagement benchmarks vary by industry due to operating pressures and workforce structure. Cross-industry averaging highlights meaningful variance in growth drivers. Comparing sector-specific patterns helps organizations interpret results realistically rather than applying generic engagement expectations.
8. How does AI improve employee feedback analytics accuracy?
AI improves employee feedback analytics accuracy by identifying patterns earlier and reducing manual tagging bias. Predictive models surface driver relationships and attrition signals faster than static reports. This enables proactive prioritization instead of reactive engagement management.
9. What is the benchmark engagement score across industries?
Benchmark engagement scores across industries are best interpreted alongside participation and driver movement. A five-point scale enables standardized comparison, but context remains critical. Industry benchmarks serve as directional reference points, not fixed performance ceilings.
10. How do employee feedback tools influence retention rates?
Employee feedback tools influence retention rates by surfacing risk signals early and guiding targeted action. When engagement drivers improve consistently, organizations reduce preventable attrition. Structured analytics and disciplined follow-through convert survey insights into measurable retention stability.


