What engagement survey results actually are
Engagement survey results are the feedback metrics HR teams use to evaluate sentiment, catch morale dips and build workplaces people stay in. They arrive as a mix of quantitative scores and open-text comments, and the two halves answer different questions.
The scores tell you the size and location of a problem. The comments tell you what it is. Reading either in isolation produces a confident answer to something you were not asking.
Why the analysis is the work
Collecting the data is the cheap half. The value sits entirely in whether the interpretation is good enough to support a decision, which is why most of this page is about the ways that interpretation goes wrong.
The metrics that show up in the results
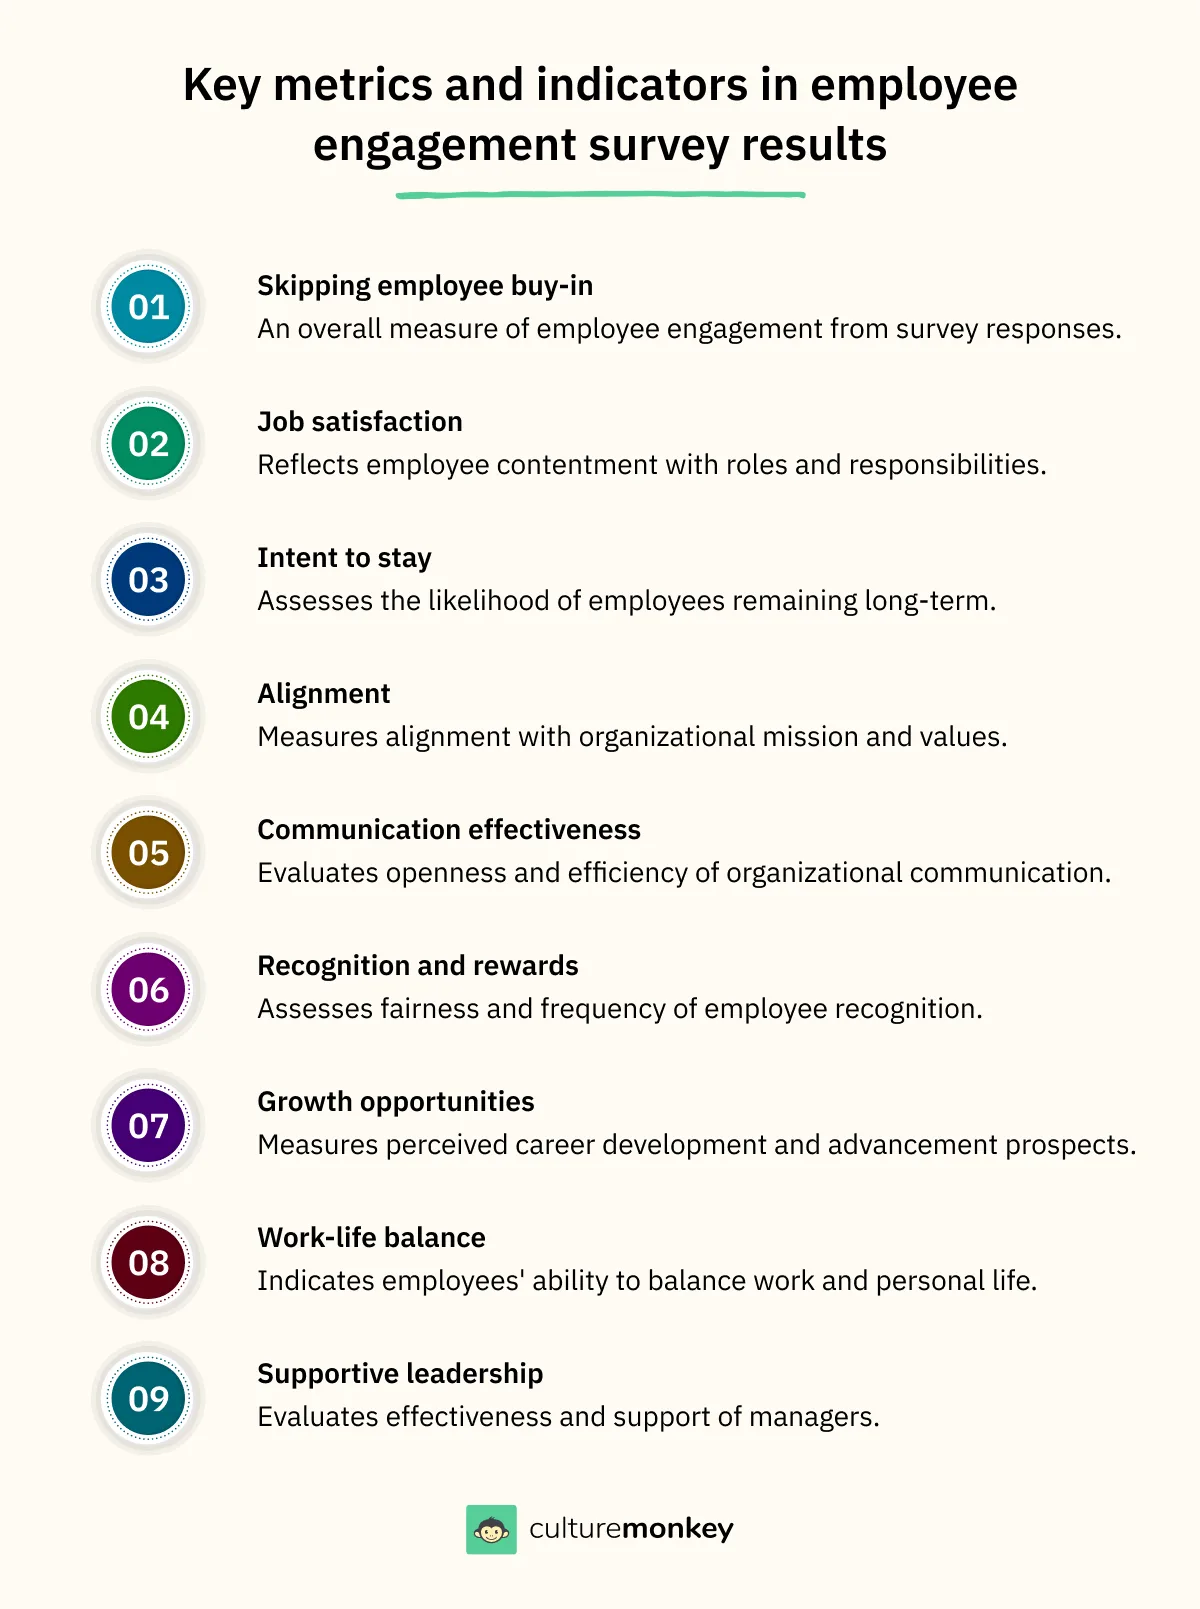
- Engagement score
The overall measure, usually calculated across several survey items. Useful as a trend, misleading as a verdict.
- Job satisfaction
How content people are with their role, responsibilities and the work itself, as distinct from their commitment to the organisation.
- Intent to stay
The likelihood of staying long term. The closest thing a survey has to a leading indicator of turnover.
- Alignment with company values
Whether people believe their own values line up with the organisation's stated mission.
- Communication effectiveness
How open and efficient internal communication is, which underlies most of the other scores.
- Recognition and rewards
Perceptions of fairness and frequency in how effort is acknowledged.
- Growth opportunities
Whether people see sufficient room for development and advancement here.
- Work-life balance
Whether the pace is sustainable, and where it stops being so.
- Supportive leadership
The effectiveness and supportiveness of the immediate manager, which is the single largest controllable driver.
- Teamwork and collaboration
Cooperation within and across departments, and where the handoffs break.
- Employee empowerment
Whether people feel able to make decisions and contribute ideas rather than execute instructions.
- Pride in the organisation
How people feel about saying where they work, which correlates with advocacy and referral.
- Employee wellbeing
Physical, emotional and mental health, which sets the ceiling on everything else.
- Diversity and inclusion
Whether people experience the organisation as promoting inclusion, rather than whether it says it does.
What counts as a good score
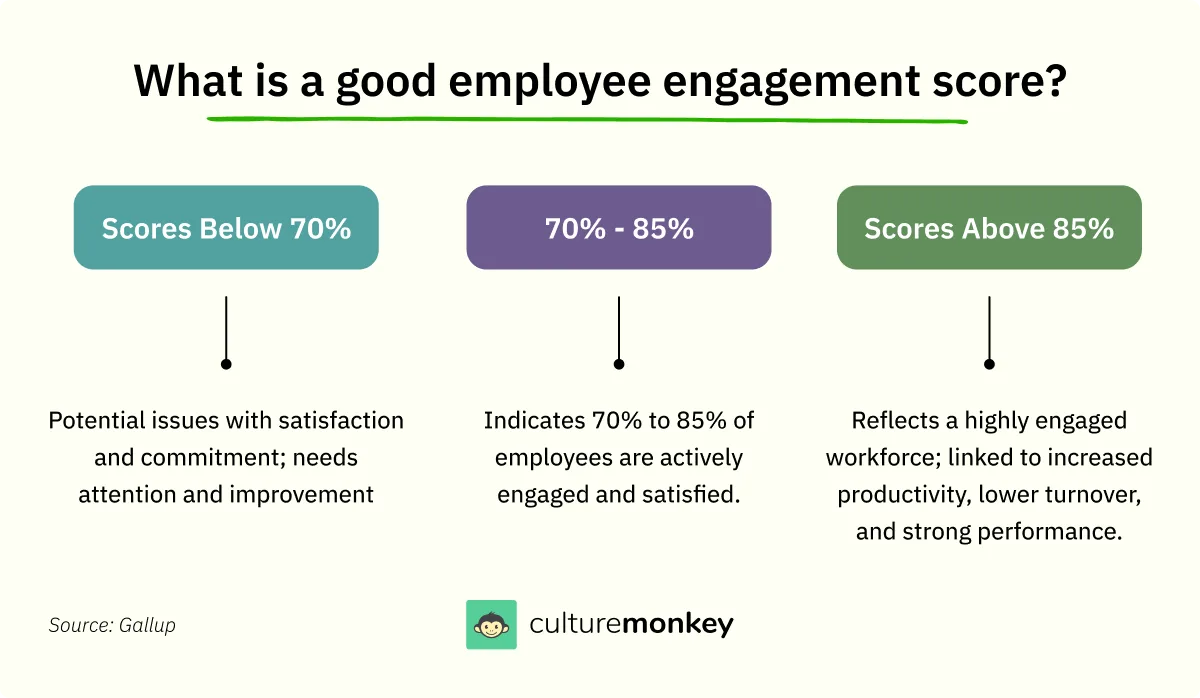
A good engagement score usually falls between 70% and 85%. That band is a starting point rather than a target: what it means depends on your sector, and the specific drivers behind the number are what any intervention has to act on.
- Below 70%Needs attentionSignals real problems with satisfaction and commitment. Worth treating as a diagnostic prompt rather than a failure grade: the useful question is which segments and drivers are pulling it down.
- 70 to 85%The usual good bandMost of the workforce is actively engaged and satisfied. This is where the headline number stops being informative and the segment breakdown starts doing the work.
- Above 85%Highly engagedAssociated with higher productivity, lower turnover and better performance. Worth checking participation and response bias before celebrating, because a high score on a low response rate is a selection artefact.
Benchmarks by industry
Comparing against a global average when you work in manufacturing or healthcare will mislead you in a predictable direction. These are the sector reference points with the sources they come from.
| Industry | Benchmark | What sits behind it | Source |
|---|---|---|---|
| Professional services | ~77% engaged | Above the global average, helped by clear career paths and strong cultures. | Gallup |
| Healthcare | 10 to 15% below average | Lags global averages, primarily on burnout and chronic stress. | HBR |
| Manufacturing | ~25% engaged | The lowest across major industries, and a persistent rather than cyclical gap. | Industry Week citing Gallup |
| Financial services | 72 to 75% engaged | Strong on the score, with work-life balance recurring in the qualitative feedback. | Gallup |
Retail and hospitality are frequently quoted alongside these, but the figure usually cited traces back to the healthcare source rather than a retail one, so it is left out here rather than repeated.
What makes interpretation hard
- Ambiguous responses
Vague answers make sentiment hard to read, usually because the question was too broad. The fix is question design, not more analysis.
- Response bias
People withhold honest opinions from fear of retaliation or social desirability, which skews the data in a direction you cannot see from inside it.
- Benchmarking difficulties
Survey methods and company structures vary enough that external comparison needs care. Your own history is often the better benchmark.
- Identifying actionable insights
Turning raw data into a specific improvement takes analysis and prioritisation, and it is the step most often skipped.
- Change in employee sentiment
Engagement moves with internal and external events. A single reading has no way to distinguish a trend from a moment.
- Overemphasis on scores
Focusing on the number without the underlying driver produces superficial action plans that move nothing.
- Interpreting open-ended responses
Qualitative analysis is labour-intensive and subjective, but it holds the explanations. Text analytics or structured review makes it tractable.
- Survey fatigue
Too-frequent surveys erode both participation and answer quality. Cadence is a design decision, not a scheduling one.
- Inadequate communication
Not sharing results and follow-up undermines trust and reduces the perceived value of the whole exercise.
Pitfalls to avoid
- Focusing only on the overall score
The headline masks specific issues. Always segment by team, role and location before drawing a conclusion.
- Ignoring satisfaction results
Engagement and satisfaction are related but distinct. Reading only one loses signals about morale and retention risk.
- Overlooking qualitative feedback
Numbers are half the story. Skipping the comments means missing the root cause you would need in order to act.
- Failing to benchmark
Without comparison you cannot tell whether your score is good for your industry or size, only whether it is high or low in the abstract.
- Delaying communication of results
People expect timely feedback. A postponed presentation erodes trust faster than a poor score does.
- Lack of transparency in sharing
Downplaying or hiding low scores damages credibility permanently. Reporting honestly is what makes the next round worth running.
- Neglecting an action plan
Presenting data without next steps makes people feel unheard, which is worse than not having asked.
- Focusing only on weaknesses
Ignoring what is working demotivates the teams doing it well and loses the evidence of what to replicate.
- Disregarding anonymous feedback
Discounting candid comments because they are anonymous undermines the mechanism that produced them.
The six biases that distort the reading
These are named failure modes rather than general carelessness, which means each one has a specific counter. Selection bias is the one worth checking first, because it invalidates everything downstream of it.
Confirmation bias
Selectively reading the data that matches what you already believed.
CounterActively look for the findings that contradict your expectation, and explain them before dismissing them.
Recency bias
Weighting a recent success or conflict more heavily than the pattern.
CounterAnalyse across time and lead with the trend rather than the latest reading.
Selection bias
Participation is not representative, so the result describes whoever answered.
CounterPush for broad participation and check the response profile against the workforce profile before interpreting anything.
Attribution bias
Reading scores as employee attitude while ignoring workload spikes or reorganisations.
CounterBring the operational context into the analysis so the score is read against what was happening.
Halo effect
A strong result in one area colours the reading of unrelated ones.
CounterAssess each dimension independently rather than forming a general impression of a team.
Social desirability bias
People give the answer they think is expected rather than the one they hold.
CounterAnonymity and a safe feedback environment, which is a structural fix rather than a wording one.
Segmenting the results
The headline number is an average of segments that frequently move in opposite directions. Segmenting is not an optional refinement; it is where the finding is.
- By department or team
Identify which teams sit above and below, and target the action plan at the ones that need it rather than everyone.
- By tenure or experience level
Comparing new hires against long-tenured staff isolates onboarding problems from retention problems.
- By location or region
Geographic patterns surface issues with local leadership or conditions that a global view averages away.
- By role or job function
Managers, frontline staff and executives experience the organisation differently enough to need separate readings.
- By demographics
Where appropriate and where anonymity thresholds allow, to check that the experience is equitable rather than assumed to be.
- By performance level
Relating engagement to performance identifies what is actually driving the results you want more of.
- Over time
Comparing against previous cycles is what measures whether the action plan did anything.
Six steps for responding to results
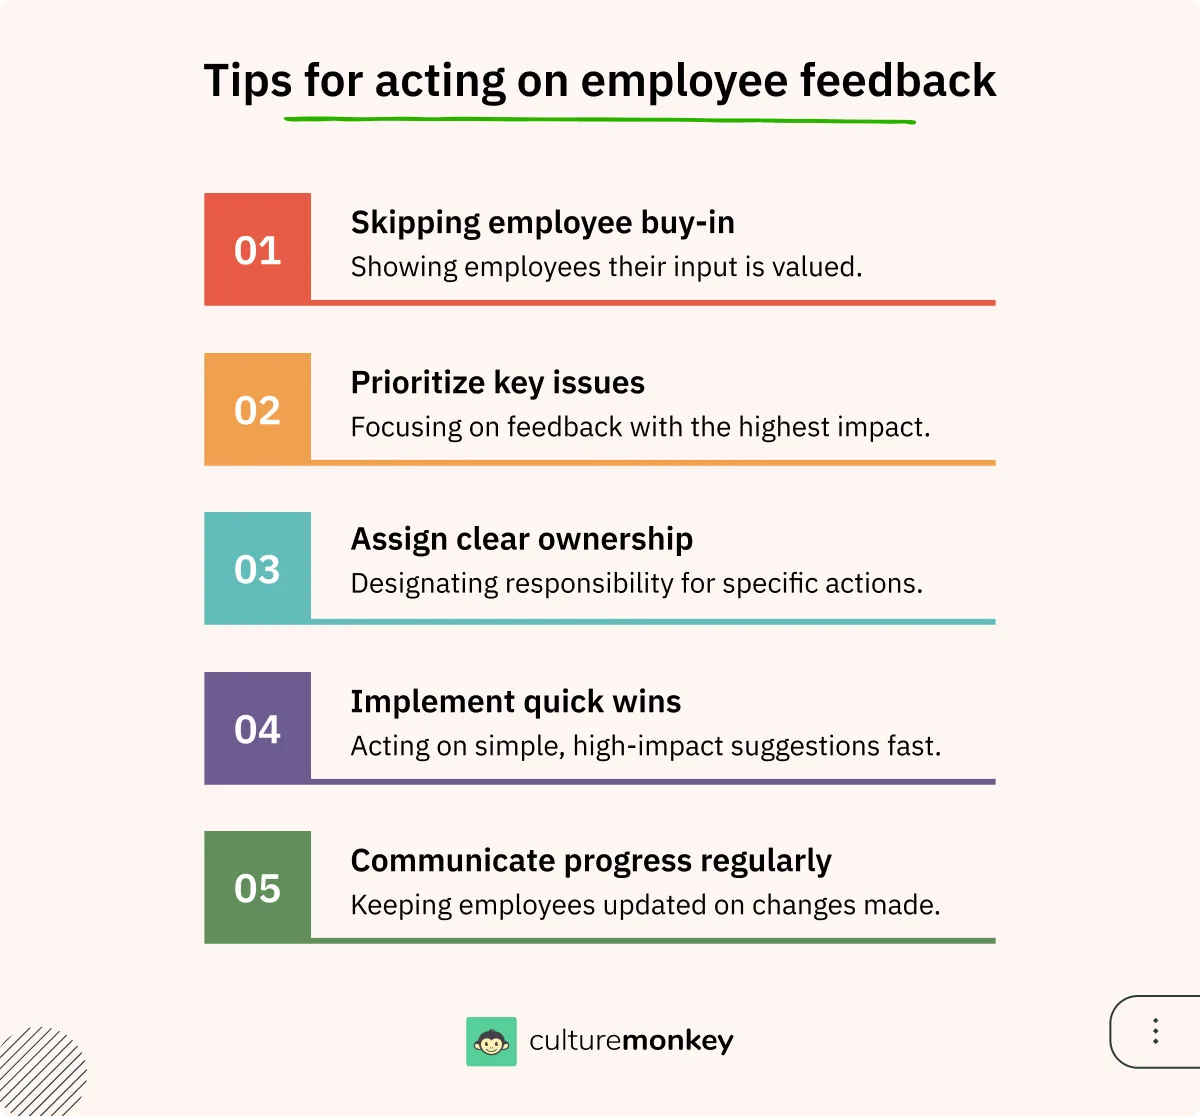
- Acknowledge and share results
Communicate the findings transparently and summarise the key insights. This first step is what signals the feedback was actually read.
- Analyse data for root causes
Dig into the underlying issues and patterns rather than the symptoms, or the action plan treats the wrong thing.
- Prioritise areas of focus
Not everything can be tackled at once. Rank by impact on engagement and on business outcomes, and be explicit about what is being deferred.
- Develop targeted action plans
Build tailored strategies with the relevant teams, with clear steps and measurable goals rather than intentions.
- Involve employees in solutions
Inviting people into the solution produces buy-in and practicality, and it catches the fixes that would not have worked.
- Communicate progress and next steps
Update regularly on milestones, successes and what is still open. Sustained visibility is what makes the next survey credible.
Communicating the results
All-hands meeting
A company-wide session sharing the themes, trends and immediate actions, with open questions. The format itself signals transparency.
Departmental presentations
Results tailored per department, focusing on what is relevant to that team. This creates local accountability rather than a general sense of concern.
Visual reports and infographics
Dashboards and visual summaries make complex data accessible to people who will not read a deck, which is most people.
Prioritising the actions
- Focus on low-scoring areas
Start with the weakest segments, especially those affecting retention, productivity or culture.
- Consider business impact
Align the plan with the areas tied to outcomes leadership already tracks, which is what gets it resourced.
- Weigh employee sentiment
Use the qualitative feedback to gauge which issues actually matter most to people, which is not always the lowest number.
- Look for quick wins
Some actions move a score quickly. Doing one early builds the momentum and credibility the harder ones need.
- Address systemic issues
Prioritise root causes over surface fixes, even where the surface fix would be visible sooner.
- Leverage segmentation
Target the most at-risk teams and roles first rather than distributing effort evenly across everyone.
- Maintain transparency
Share the reasoning behind the priorities. People accept not being first if they can see why.
Linking results to business outcomes
- Compare engagement to business KPIs
Track how the score correlates with productivity, customer satisfaction or revenue. That correlation is what makes the case for investment.
- Use satisfaction to predict retention
Low satisfaction reliably precedes turnover, and turnover is expensive enough to justify acting on a leading indicator.
Engagement results alone do not tell the full story. Without operational context, a score drop reads as an attitude problem when it is usually a workload spike, a reorganisation, or a manager change nobody thought to note in the analysis.
How CultureMonkey handles the analysis
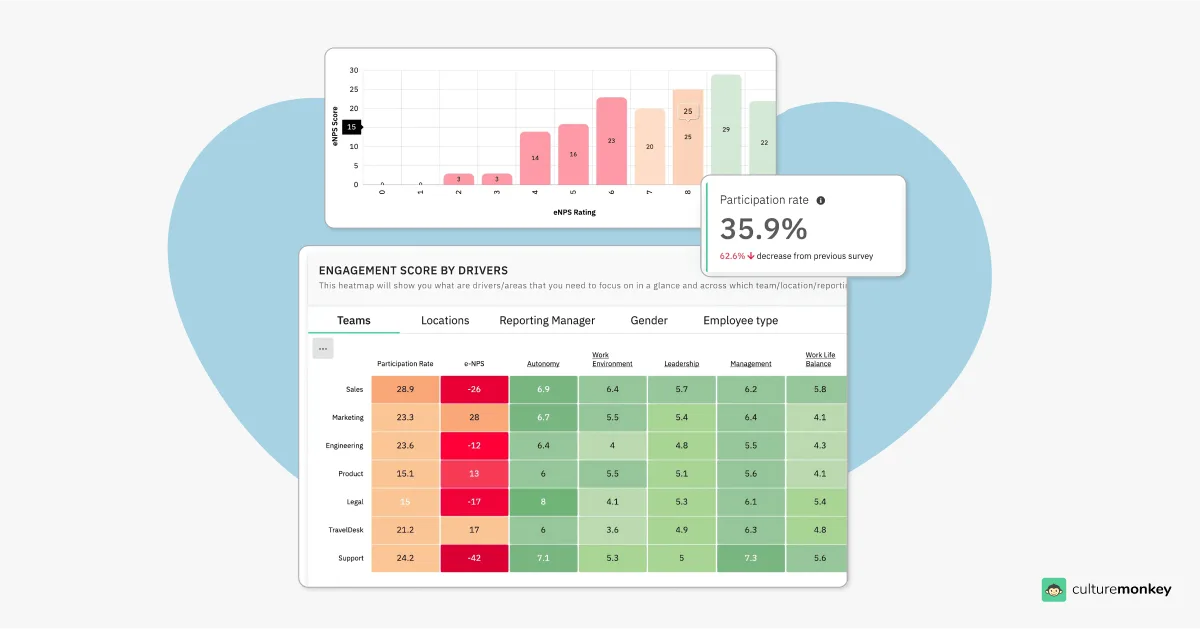
Survey results dashboard
Consolidates survey data into one view so overall engagement is assessable at a glance, which is where trends and problem areas first become visible.
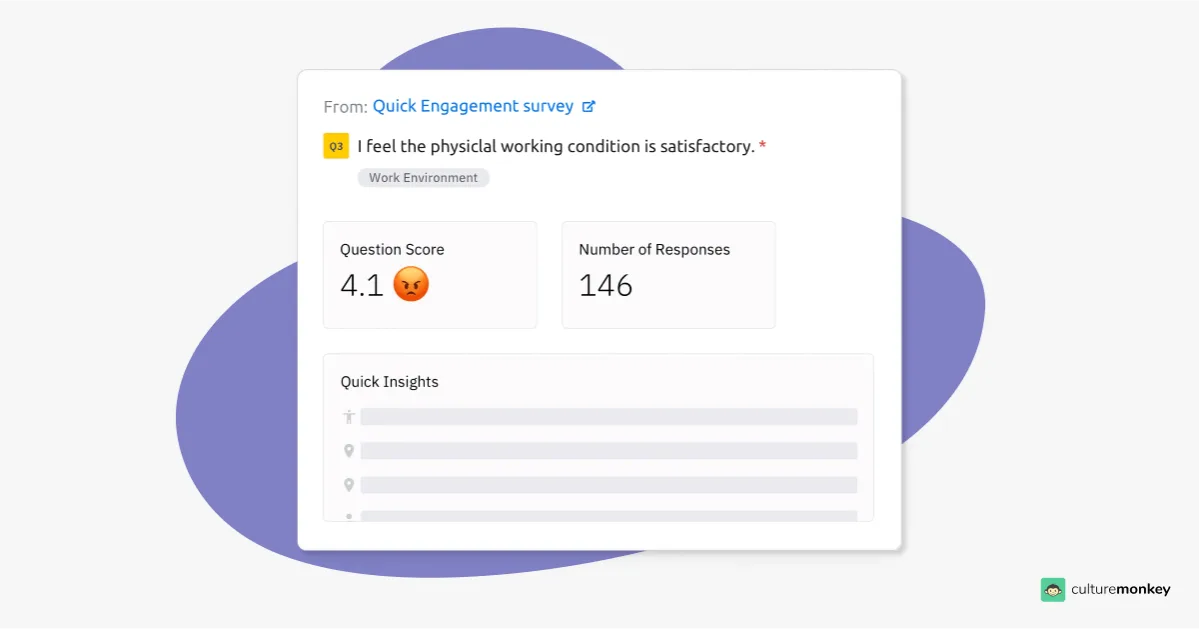
Drill into specific questions
Analyse responses item by item to find the precise driver behind a score, so the intervention targets a cause rather than a category.
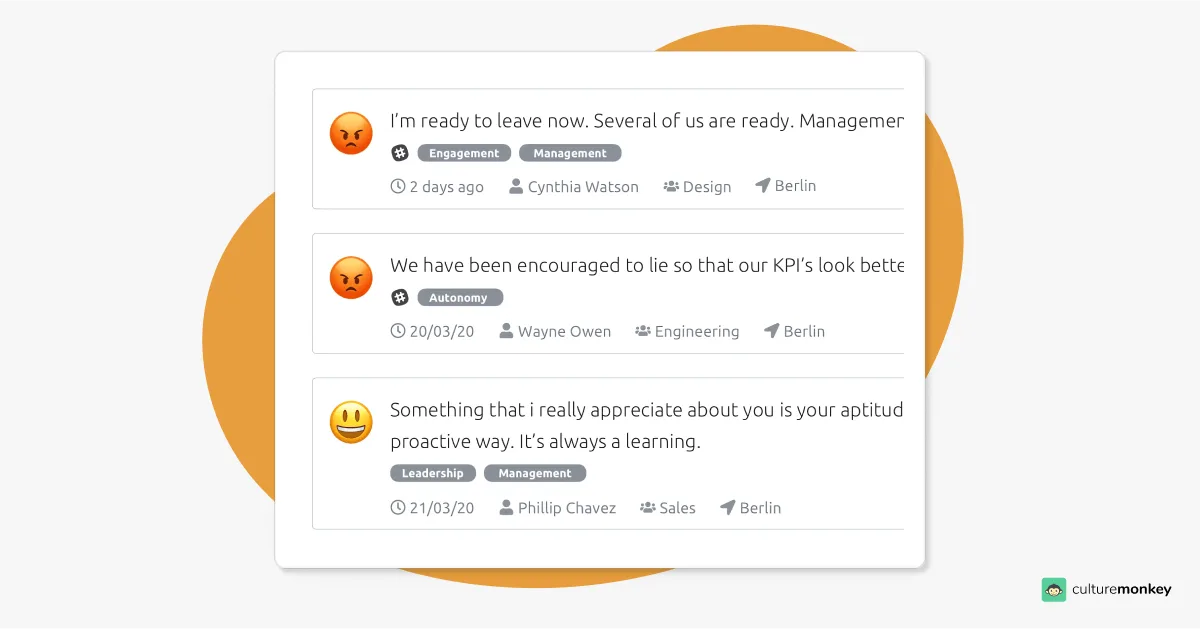
Real-time feedback feed
See feedback as it arrives rather than at the end of the cycle, which is what makes it possible to respond while the context is still current.
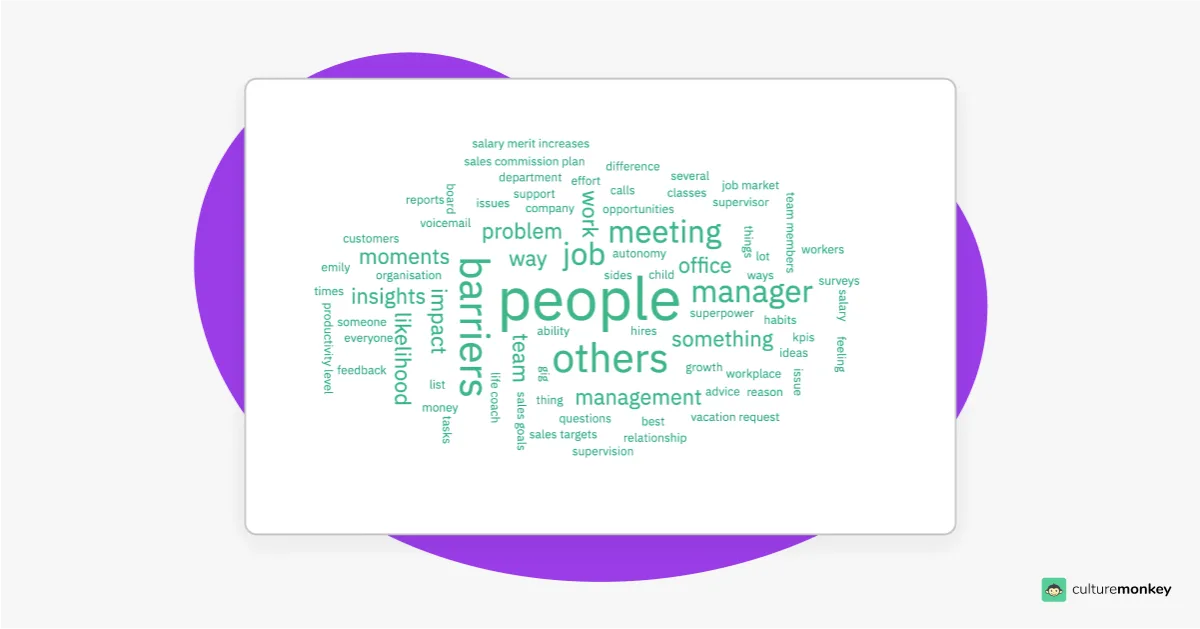
Sentiment word cloud
Visualise the language people are actually using, which surfaces themes that a numeric summary of the same responses would flatten.
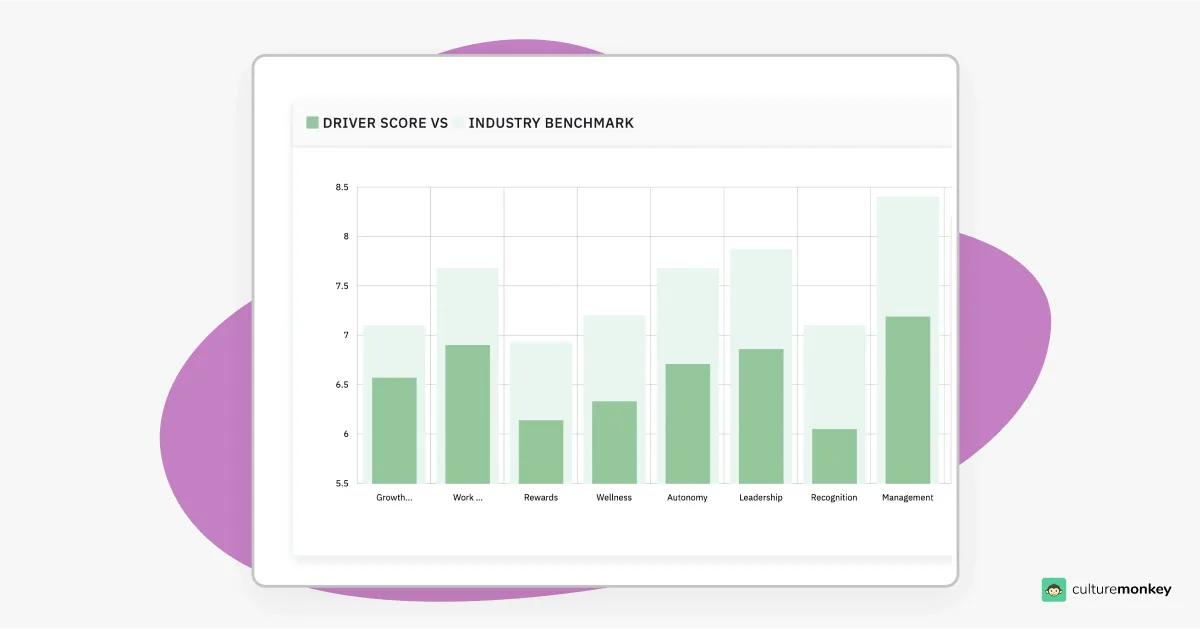
Industry benchmarking
Compare against sector reference points so a score has a context, rather than being high or low relative to nothing in particular.
Executive reporting
Make the data accessible to leadership in a form that supports a decision, which is a different artefact from the analysis that produced it.
Frequently asked questions
What does it probably mean if you have consistently low scores on an employee engagement survey?
Consistently low engagement scores often indicate underlying issues such as poor leadership, lack of recognition, limited growth opportunities, or low trust in the organization. It reflects disengaged employees who may feel undervalued, unmotivated, or unheard. This signals a need for deeper analysis, transparent communication, and targeted initiatives to address root causes and create a more positive work environment.
What do employee engagement surveys measure?
Employee engagement surveys measure how connected and committed employees feel toward their organization, their work, and its values. These surveys typically assess job satisfaction, communication effectiveness, leadership quality, workplace culture, growth opportunities, recognition, and overall employee morale. The goal is to understand employee sentiment, uncover areas of strength, and identify gaps that may be hindering engagement and productivity.
How often should employee engagement survey results be reviewed?
Employee engagement survey results should be reviewed regularly to track trends and ensure timely responses. Typically, annual or biannual reviews are common for comprehensive surveys. However, pulse surveys—shorter, more frequent check-ins—can be conducted quarterly or monthly to maintain a continuous understanding of engagement levels, gauge evolving employee sentiments, and promptly address emerging issues with targeted interventions.
How do we ensure anonymity while addressing specific feedback?
To ensure anonymity while addressing specific feedback, use aggregated data and anonymized comments without identifying individual employees. Confidential third-party survey tools can collect responses, and group feedback can be discussed without singling out contributors. Emphasizing confidentiality and transparency builds trust, encouraging candid and open feedback while enabling the organization to act on it constructively.
Who should be involved in developing action plans from survey results?
Developing action plans from survey results should involve a cross-functional team, including HR, managers, and senior leadership. Employee representatives or focus groups can also provide valuable input, ensuring initiatives reflect diverse perspectives. Collaborative involvement helps create practical, targeted solutions, aligns actions with organizational goals, and demonstrates a commitment to listening and improving workplace culture.
How do I analyze open-ended responses from surveys?
To analyze open-ended survey responses, start by reading through all feedback to identify recurring themes or sentiments. Group similar comments into categories and look for patterns and frequency to prioritize issues. Highlight impactful quotes to illustrate key points. Use these insights alongside quantitative data to guide your employee survey results action plan and communicate findings effectively.
Should I share employee survey results with my team?
Yes, share employee survey results with your team to foster transparency, trust, and engagement. Communicate both positive findings and areas for improvement, showing feedback matters. Use a clear, judgment-free approach and outline next steps. Sharing results encourages dialogue, builds accountability, and helps employees feel included in shaping meaningful changes based on the survey insights.
What happens after survey results are collected?
After survey results are collected, analyze data to identify key themes, trends, and priorities. Prepare a clear employee engagement survey presentation to share findings with leadership and employees. Communicate results transparently, then create an actionable plan addressing concerns. Follow up regularly to track progress, adjust strategies, and show employees their feedback leads to meaningful improvements.
What are the 5 C's of employee engagement?
The 5 C’s of employee engagement are Connection, Communication, Career, Clarity, and Contribution. Employees feel engaged when they’re connected to their team, have open communication, see career growth opportunities, understand clear goals, and feel their work contributes to organizational success. Focusing on these areas helps improve employee satisfaction survey results and strengthens overall engagement across the organization.
How should managers be trained to interpret and act on team-level employee engagement survey results?
Managers should be trained to read survey data objectively, avoid defensiveness, and lead open conversations with their teams. Equip them with facilitation tools, context on engagement drivers, and action planning templates. Empowering managers to co-create solutions fosters ownership, accountability, and team trust—key ingredients for turning survey insights into sustainable, meaningful, and lasting workplace improvements.
What are early warning signs in employee engagement survey results that leaders often overlook?
Leaders often miss early disengagement signs hidden in subtle score drops—especially around trust, recognition, and psychological safety. Even average scores with downward trends signal future issues. These overlooked patterns can precede spikes in turnover, burnout, or quiet quitting. Acting early on small dips can prevent larger culture, retention, and performance problems from taking deeper organizational root.