

Track pulse schedule and participation in CultureMonkey
How to see upcoming and past pulse runs on the schedule timeline, monitor response rates per run and over time, and what to do when participation is low.
On this page
Once your pulse is running, the day-to-day question shifts from "how do I set this up?" to "is it actually reaching people, and are they responding?" A pulse only earns its keep if enough employees answer each run, cycle after cycle. This guide shows you where to see upcoming and past pulse runs, how to read the response rate for any single run, how to watch that rate move across runs, and what to do when it starts to slip.
If you haven't launched a pulse yet, start with Set up a pulse survey. Everything below assumes you have an active pulse sending questions on a regular cadence.
Your CultureMonkey pulse runs on a fixed cadence (weekly by default, on a set day). The Schedule timeline shows every run as PENDING, LIVE, EXPIRED, or CANCELLED. On the pulse Reports page, a set of cards shows the participation rate for the previous, live, and next run: the share of employees who received a question and then answered it. Watch that rate across runs, not just once, and use reminders and closing the loop to lift it.
How a pulse is scheduled
A pulse survey doesn't fire all its questions at once. When you activate a pulse, CultureMonkey builds a queue of questions and spaces them out on your chosen frequency. Each release of a question (or small set of questions) to employees is a run.
Two settings control the rhythm, both defined when you set up the pulse:
- Frequency - how often a run goes out. The options are Daily, Weekly, Bimonthly (every two weeks), and Monthly. Weekly is the most common choice.
- Day of the week - which day each run is sent. By default a pulse goes out on Wednesday, but this is set at creation.
Each run has a start date (when the question is sent) and an end date (when it stops accepting responses, just before the next run begins). Because runs are spaced out, employees answer one short question at a time rather than a long survey, which is exactly what keeps pulse fatigue low and response rates high.
The frequency you pick isn't just an operational detail - it directly shapes participation. Too frequent and people tune out; too rare and the pulse loses momentum. If your response rate is drifting down, your cadence is one of the first things to revisit. See Set up a pulse survey to change it.
The schedule view: past, live, and upcoming runs
To see every run in one place, open Listen > Pulse and choose the Schedule tab. This is a vertical timeline of the pulse: each block is one dated run, ordered from earliest to latest, so you can scroll from where the pulse started through to what's coming next.
Every run on the timeline carries a status that tells you exactly where it sits in its lifecycle:
| Status | What it means |
|---|---|
| PENDING | Scheduled for the future. It hasn't been sent yet, so there's no participation data. |
| LIVE | Currently out with employees and accepting responses right now. |
| EXPIRED | Finished. It ran, closed, and its responses are counted in your reports. |
| CANCELLED | Was scheduled but never sent, usually because you changed the pulse settings and rebuilt the queue. |
Inside each run block you'll also see the driver being measured (shown as a badge, or "eNPS" for a recommendation run) and the question behind it. For live and expired runs, the badge also shows the number of participants - how many employees that run was sent to. That count is deliberately not shown for pending runs.
Participant counts are computed at the moment a run launches, not when it's scheduled. This is intentional: it lets a run pick up new employees who joined between scheduling and launch, so nobody who should be surveyed gets left out. A pending run has no count yet because its audience isn't final.
If you've just enabled a pulse and the timeline is empty, that's expected - the schedule populates as the queue is built and the first runs are dated. Give it a moment and refresh.
Reading participation for a single run
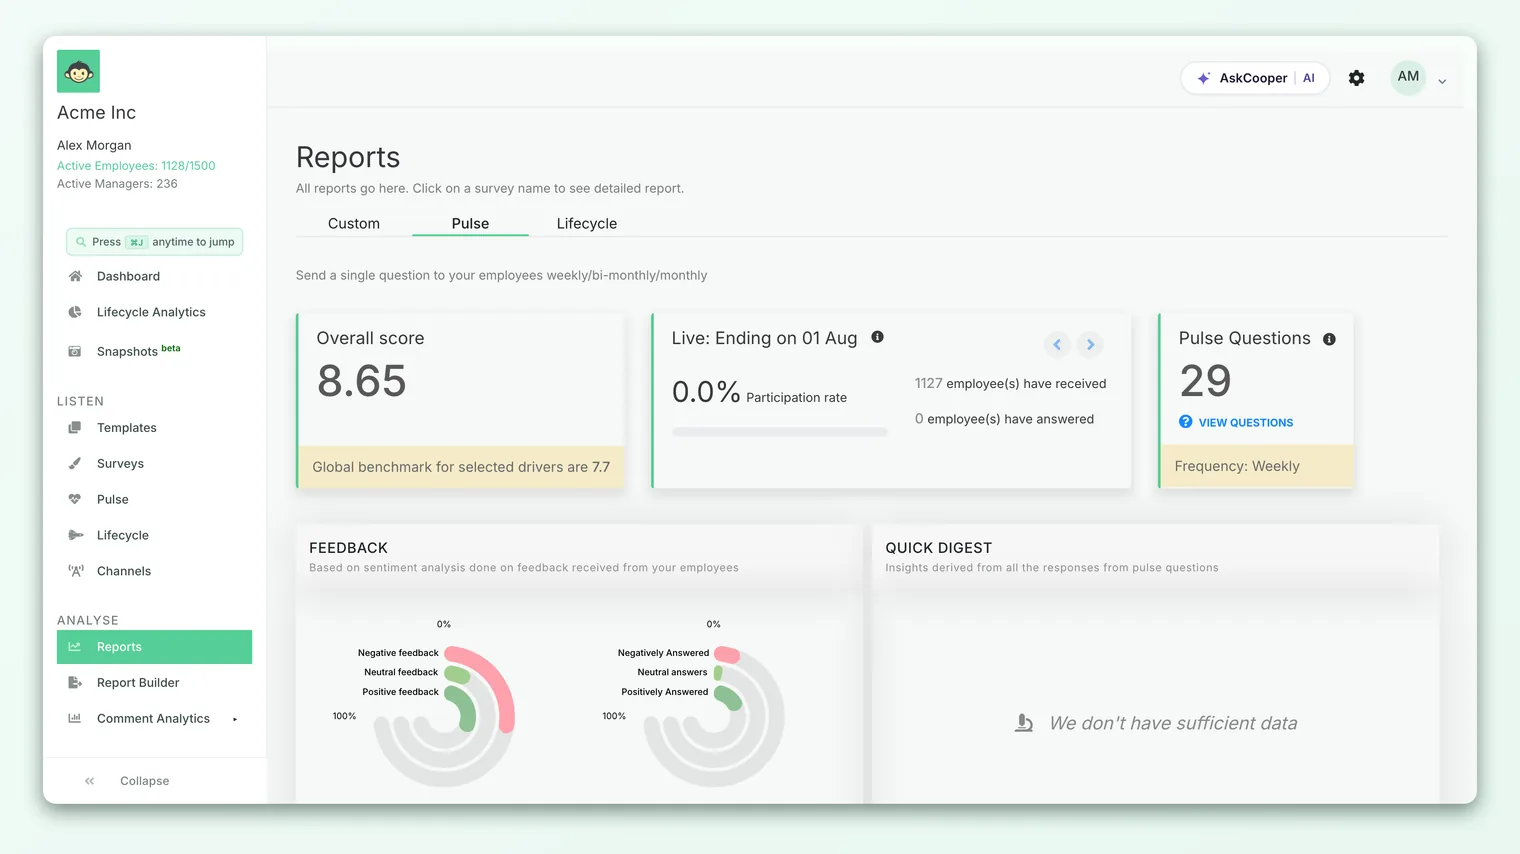
Response rate lives on the pulse Reports page (Listen > Pulse > Reports). Near the top you'll find a small set of cards you can scroll through, one each for the Previous, Live, and Next run. Each card is a focused snapshot of that run's reach and response.
Each card shows three things:
- Participation rate - the headline percentage, drawn as a progress bar so you can gauge it at a glance.
- Employees who received - how many people the run was sent to.
- Employees who answered - how many of them submitted a response.
The Live card is the one to watch during an active run: the rate climbs as responses come in through the day. The Previous card is your most recent completed run, and the Next card shows the upcoming run's drivers and start date (its participation figures read as dashes, since it hasn't gone out yet).
How the participation rate is calculated
The rate is a simple, honest ratio:
> Participation rate = (employees who answered ÷ employees who received) × 100
So if a run was sent to 240 employees and 168 of them answered, the rate is 168 ÷ 240 = 70%. The denominator is who the run actually reached, not your whole headcount, which is why the participant count on the schedule matters: a run that launched with more employees is being measured against that larger, current audience.
Pulse response rates tend to run higher than full engagement surveys because each run is one short question. Many teams see 60% or more on a healthy weekly pulse, and strong programs push past 75%. As with eNPS, the trend matters more than any single number: a steadily climbing rate is a better sign than a high one that's slipping. See What is eNPS and how is it calculated? for more on why trend beats snapshot.
Tracking participation across runs
A single run's rate is a data point. The real signal is the shape over time: is participation holding steady, climbing, or fading run after run? CultureMonkey gives you two ways to read that.
Compare consecutive runs. The Previous, Live, and Next cards let you eyeball momentum without leaving the page: if the previous run landed at 68% and the live one is tracking well below that at the same point in its cycle, something has changed. The pulse Reports page also shows an overall score with a delta against the last pulse survey, so you can see engagement and participation moving together (or diverging, which is itself worth investigating).
Watch participation by month and by segment. Behind the reports, CultureMonkey rolls response rates up by month and can break them down by team, manager, or location. This is what powers the driver performance and over-time views: for a given segment you get its monthly participation rate alongside its scores, so a dip shows up as both a lower bar and, often, thinner data behind the score. That pairing is the point - a score built on a shrinking response base deserves more caution than one built on a stable, healthy one.
When a specific team's response rate falls while others hold steady, that's rarely random. It usually points to survey fatigue on that team, a manager who isn't encouraging responses, or eroding trust that feedback leads anywhere. Treat a localized participation dip as a signal to look into, not just a number to fix.
When a run is live: reminders
The single most direct way to lift a live run's participation is a reminder to employees who haven't answered yet. CultureMonkey supports two kinds:
- Scheduled reminders - configured as part of your pulse so they go out automatically during each run. When present, a Reminders tab appears under Listen > Pulse, listing each reminder with its date, channel, and (once sent) how many participants it reached.
- Manual reminders - you can trigger a reminder on demand from the pulse settings. To prevent spamming, only one reminder per day can be sent, and a manual reminder is queued to go out a couple of minutes after you trigger it.
If you try to send a second manual reminder on the same day, CultureMonkey will block it and ask you to try again tomorrow. This guardrail protects the employee experience: a pulse that nags is a pulse people learn to ignore. Use reminders deliberately, not reflexively.
What to do about low participation
A low or falling response rate is a prompt, not a verdict. Work through it in roughly this order:
- 1Check the reach, not just the rate. Open the Schedule and confirm the run's participant count looks right. If far fewer employees received it than you expected, the issue may be your audience or channel setup rather than employee willingness. Fix delivery before chasing responses.
- 2Send a reminder to the live run. For a run that's still open, a single well-timed reminder is the fastest lever. Nudge the people who haven't answered yet.
- 3Find where the dip is concentrated. Break participation down by team, manager, or location. A company-wide average can hide one struggling team. Localized dips point to a specific cause you can actually address.
- 4Revisit your cadence. If participation is trending down across the board over many runs, the pulse may simply be going out too often. Easing the frequency can restore the novelty that drives responses. See Set up a pulse survey.
- 5Close the loop. The deepest cause of falling participation is the belief that answering changes nothing. Visibly acting on what the pulse surfaces, and telling people you did, is the most durable way to rebuild response rates over time.
Reminders lift a single run. Closing the loop lifts every future run. Employees who see their feedback lead to real change keep answering; those who feel unheard quietly stop. If you only invest in one thing, invest in showing people their pulse responses mattered.
Participation and anonymity
Like everything in CultureMonkey, pulse results are protected by anonymity thresholds. If a run reaches only a handful of people, or you filter participation down to a very small group, the underlying scores are hidden until enough responses come in, so no individual's answer can be inferred. You'll still see that a run happened and how many received it, but segment scores stay masked until the group is large enough. This is expected behaviour. If a breakdown looks empty, see Why can't I see results yet?.
Frequently asked questions
What's the difference between "received" and "answered"?
"Received" is how many employees a run was sent to (the participant count). "Answered" is how many of them submitted a response. The participation rate is answered divided by received. A gap between the two is your opportunity: those are the people a reminder can reach.
Why does my upcoming run show dashes instead of a participation rate?
Because it hasn't gone out yet. Pending and next runs have no responses, and their participant count isn't finalized until they launch (so they can include employees who join in the meantime). Figures appear once the run goes live.
A run shows as CANCELLED. Did something break?
Almost always no. Runs are marked CANCELLED when you change your pulse settings and the queue is rebuilt: the old, not-yet-sent runs are retired and fresh ones scheduled. Live runs at that point become EXPIRED. It's the system keeping the schedule consistent with your latest settings.
How often can I remind employees during a run?
Once per day. CultureMonkey blocks a second manual reminder on the same day to protect the employee experience. Scheduled reminders, if you've configured them, run automatically within that same guardrail.
Can I see participation for just one team?
Yes. Participation rolls up by month and can be filtered by team, manager, or location, so you can spot exactly where response rates are strong and where they're slipping, provided the group is large enough to meet the anonymity threshold.
Does a lower participation rate change my scores?
It doesn't change how a score is calculated, but it does change how much you should trust it. A score built on a small share of a team rests on a narrower base, so treat scores with thin participation more cautiously and prioritize lifting the response rate.
Where to go next
- Set the cadence and questions: Set up a pulse survey
- Understand a key pulse metric: What is eNPS and how is it calculated?
- Results not showing? Why can't I see results yet?
Your feedback helps us improve the Help Center.