

What is eNPS and how does CultureMonkey calculate it?
A complete guide to Employee Net Promoter Score - what it measures, exactly how the number is calculated, what a good score looks like, how to read it in CultureMonkey, and how to actually improve it.
On this page
eNPS - Employee Net Promoter Score - is one of the simplest and most widely-used ways to measure how your people feel about working for your organization. In a single number, it captures whether employees are, on balance, advocates for your workplace or critics of it. CultureMonkey calculates eNPS from a single 0-10 rating question and reports it next to your engagement drivers, so you see the headline number and what is moving it in one place.
This guide covers everything you need to use eNPS well: what it is and where it comes from, exactly how the score is calculated, what counts as a "good" score, how to find and read it inside CultureMonkey, and - most importantly - how to move it in the right direction.
eNPS asks employees how likely they are to recommend your organization as a place to work, on a 0-10 scale. CultureMonkey subtracts the percentage of detractors (0-6) from the percentage of promoters (9-10), which gives a score between −100 and +100. Higher is better, but the trend matters more than any single number.
Where eNPS comes from
eNPS is the employee-focused cousin of the Net Promoter Score (NPS), a customer-loyalty metric introduced in the early 2000s. NPS asks customers how likely they are to recommend a product or company; eNPS applies the same elegant idea to your workforce.
Its popularity comes from three things:
- It's simple. One question, a 0-10 scale, one number. Anyone in the business can understand it.
- It's comparable. Because everyone calculates it the same way, you can track it over time and benchmark it against others.
- It's a leading indicator. How willing people are to recommend you as an employer tends to move before harder outcomes like attrition and productivity - giving you time to act.
Why eNPS matters
A recommendation is a high bar. An employee only tells a friend "come work here" if they genuinely believe in the experience - the work, the managers, the culture, the growth. That makes eNPS a useful proxy for overall employee sentiment and loyalty.
Tracked consistently, eNPS helps you:
- Spot momentum - is sentiment improving or slipping across the organization?
- Find hotspots - which teams, locations or managers have strong advocacy, and which need attention?
- Connect engagement to outcomes - advocacy correlates with retention, referrals, and discretionary effort.
- Rally the business - a single, trending number is easy for leaders to understand and commit to.
eNPS tells you how people feel; it doesn't tell you why. Always pair it with your open-text feedback and your engagement driver scores to understand the reasons behind the number. More on that below.
The eNPS question
At the heart of eNPS is one question, asked on an 11-point scale from 0 to 10:
> "On a scale of 0-10, how likely are you to recommend this organization as a place to work?"
Some organizations lightly reword it (for example, "…recommend [Company] to a friend or colleague as a place to work?"). The exact wording can vary, but two things should stay constant: the 0-10 scale and the focus on recommending your organization as an employer. Changing the scale or the intent breaks comparability with past results and external benchmarks.
Many teams also add an optional open-text follow-up - "What's the main reason for your score?" - which turns eNPS from a number into a source of specific, actionable feedback.
How the score is calculated
Every respondent is sorted into one of three groups based on their 0-10 answer:
| Group | Score they gave | What it means | What they tend to do |
|---|---|---|---|
| Promoters | 9-10 | Loyal enthusiasts | Speak positively, refer others, stay longer |
| Passives | 7-8 | Satisfied but unenthusiastic | Content for now, but easily tempted away |
| Detractors | 0-6 | Unhappy or disengaged | May criticize the workplace and are a flight risk |
The score itself is a straightforward subtraction:
> eNPS = % Promoters − % Detractors
Passives are counted in the total number of respondents (which affects the percentages), but they don't add to or subtract from the score directly. Because you're subtracting one percentage from another, the result always lands somewhere between −100 (everyone is a detractor) and +100 (everyone is a promoter).
A worked example
Imagine 200 employees respond to the eNPS question:
- 120 are Promoters (scored 9-10) → 120 ÷ 200 = 60%
- 50 are Passives (scored 7-8) → 50 ÷ 200 = 25%
- 30 are Detractors (scored 0-6) → 30 ÷ 200 = 15%
Your eNPS is:
> 60% − 15% = +45
Notice that the 25% of Passives didn't appear in the final subtraction - but they did lower the promoter and detractor percentages by being part of the total. That's why moving Passives up into Promoters is one of the most reliable ways to lift your score.
eNPS is conventionally reported as a whole number (e.g. +45, not 45.3%), and it's a score, not a percentage - even though percentages are used to calculate it. You'll sometimes see it written with a plus sign to make the direction clear.
What is a "good" eNPS?
This is the most common question - and the honest answer is it depends. eNPS varies widely by industry, region, company size, and the moment you measure it (a score taken right after a restructure will look different from one taken after a great quarter). There is no single universal benchmark.
That said, these ranges are a reasonable rule of thumb for interpreting a score:
| eNPS range | General reading |
|---|---|
| Below 0 | More detractors than promoters - a clear signal to dig into the "why" |
| 0 to +20 | A reasonable, positive baseline for many organizations |
| +20 to +40 | Good - a healthy, engaged workforce |
| +40 to +60 | Strong advocacy; you're doing a lot right |
| Above +60 | Exceptional - world-class employer sentiment |
Use these as orientation, not as targets. Two principles matter more than the band you fall into:
- The trend beats the number. A score of +15 that has climbed steadily for a year is a better sign than a static +40. Consistent improvement is the real win.
- Segments beat the average. A healthy company-wide eNPS can easily hide a struggling team. Always look beneath the headline number.
If eNPS becomes a target that managers are pressured to hit, people may start "gaming" it - and you lose the honest signal that made it valuable. Treat eNPS as a thermometer, not a thermostat: it tells you the temperature; your actions change it.
eNPS vs your overall engagement score
CultureMonkey shows both an overall engagement score and eNPS, and they answer different questions:
| eNPS | Overall engagement score | |
|---|---|---|
| Question it answers | Would you recommend us as an employer? | How engaged are you across many dimensions? |
| Based on | One recommendation question | Many questions across engagement drivers |
| Scale | −100 to +100 | Typically a 0-10 (or 0-100) index |
| Best for | A quick, comparable pulse of advocacy | A richer, diagnostic view of engagement |
They complement each other. eNPS is the fast headline; the engagement score and its drivers are the diagnosis. When both move together, you have a clear story; when they diverge, that's a prompt to investigate.
Reading eNPS in CultureMonkey
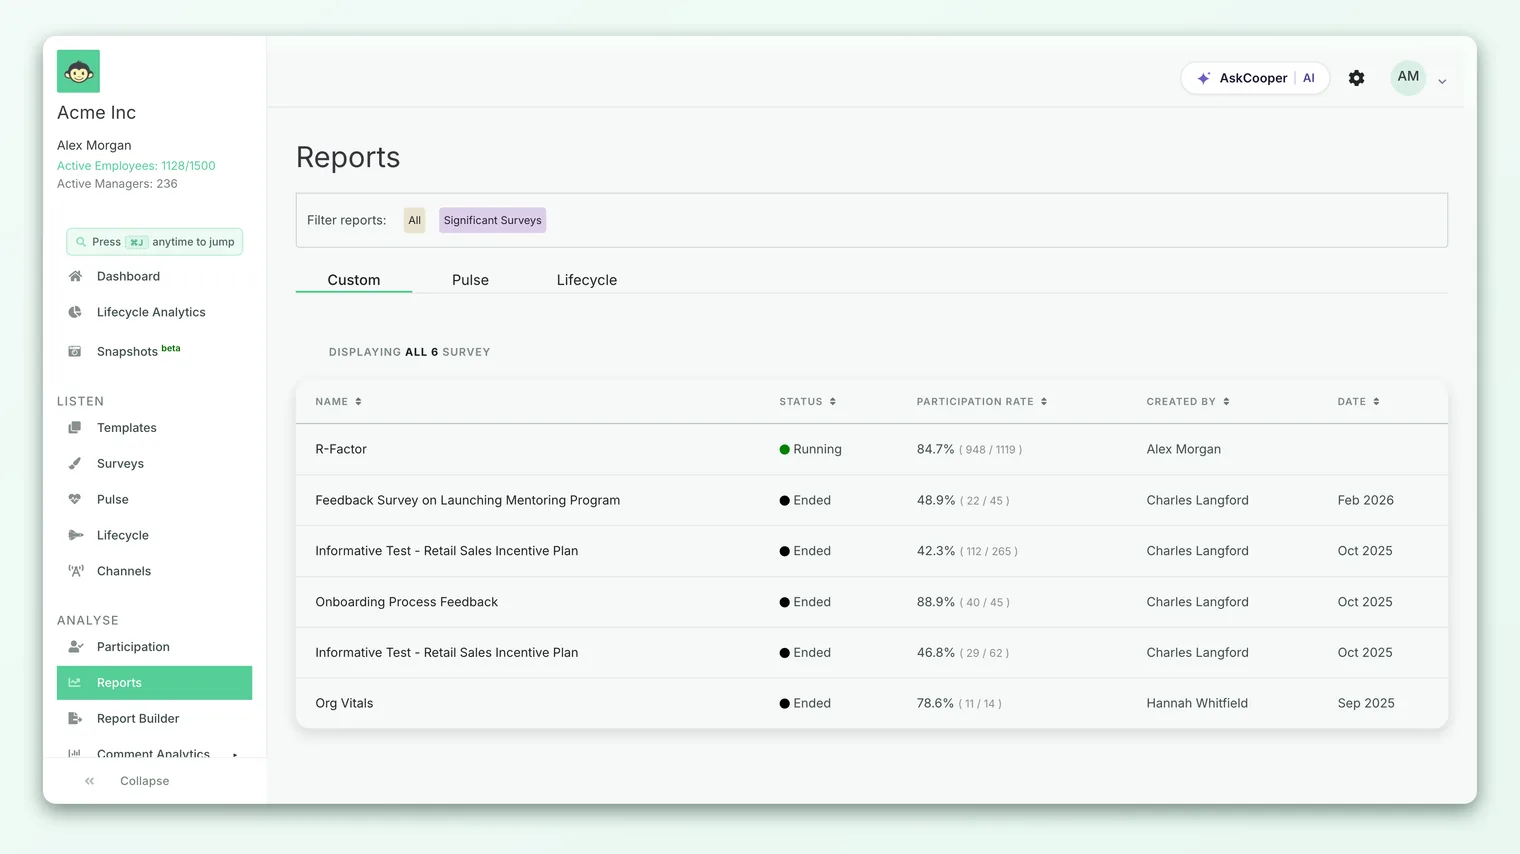
Your eNPS appears in two main places: on the Dashboard for an at-a-glance view, and inside individual survey Reports for detail.
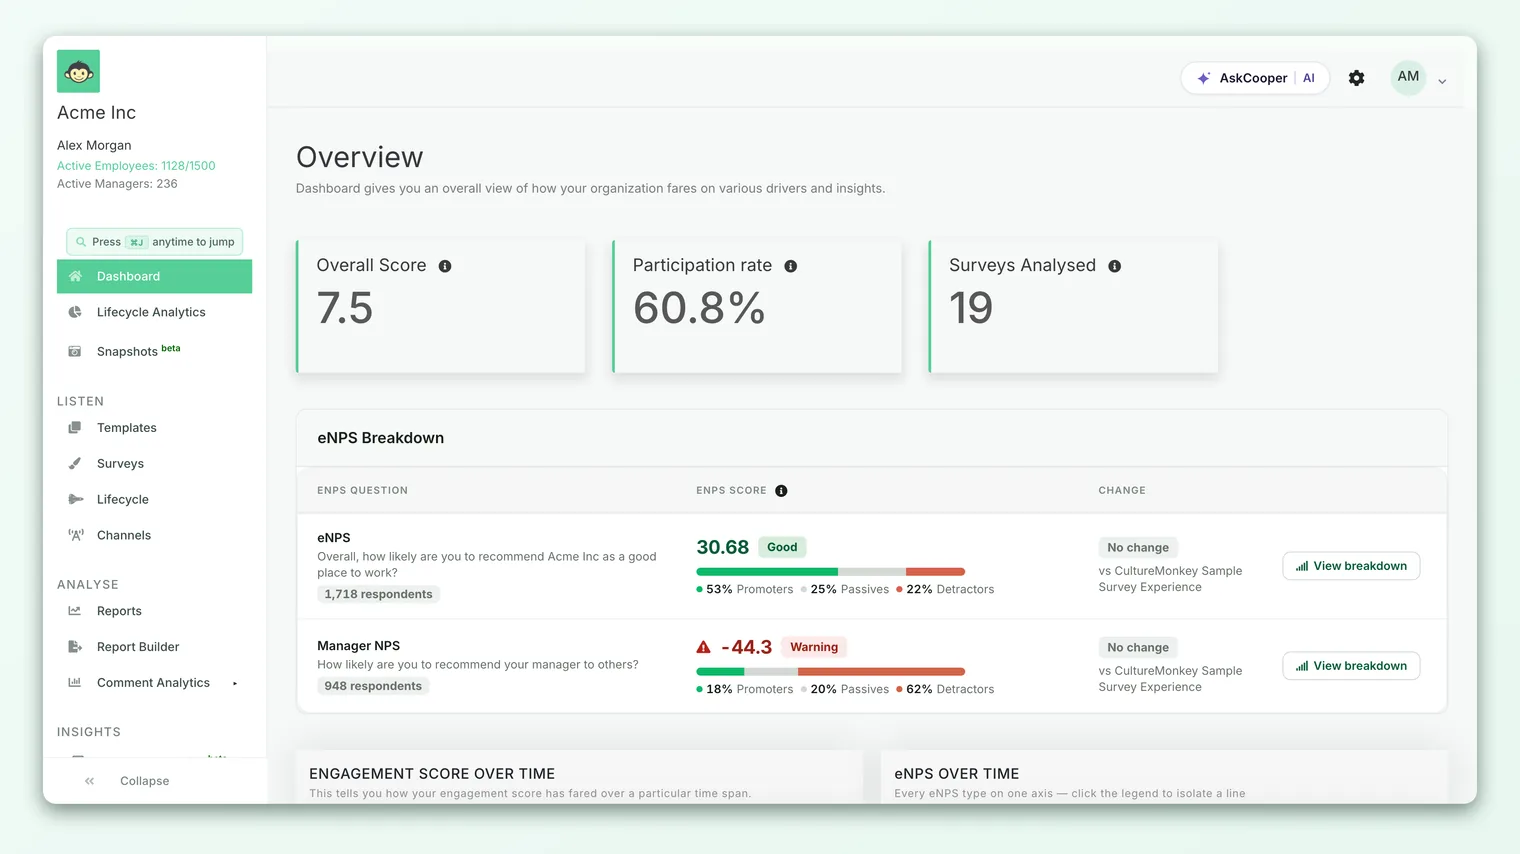
From there you can go deeper in a few ways:
- 1See the breakdown - open the eNPS view to see the split of Promoters, Passives and Detractors behind the headline number. This is where you learn how the score is composed. See View the eNPS breakdown.
- 2Track it over time - use the "eNPS over time" trend to watch how the score moves across survey cycles. A rising line is your best evidence that changes are working.
- 3Slice by demographic - filter eNPS by team, location, manager or any custom attribute to find where advocacy is strong and where it needs attention.
- 4Read the reasons - if you included the open-text follow-up, read those comments alongside the score to understand the drivers behind it.
How to actually improve your eNPS
A score only matters if you can move it. Improving eNPS is less about the metric and more about the experience behind it. A practical loop:
- 1Find the "why." Read the open-text feedback tied to your eNPS and look at which engagement drivers score lowest. These are your root causes.
- 2Focus on Passives and Detractors. Passives (7-8) are the fastest win - they're close to becoming Promoters. Understand what's holding them back. For Detractors, look for systemic issues surfacing in the comments.
- 3Turn insight into action. Create concrete action plans for the biggest drivers, assign owners, and set deadlines. Change comes from follow-through, not analysis.
- 4Close the loop with employees. Tell people what you heard and what you're doing about it. Visibly acting on feedback is itself one of the strongest ways to lift advocacy.
- 5Re-measure. Run your next survey or pulse and watch whether the score moves. Improvement compounds over cycles.
Employees who see their feedback lead to real change are far more likely to become Promoters. "You spoke, we acted" is the most reliable eNPS booster there is.
eNPS and anonymity
Like all results in CultureMonkey, eNPS is protected by anonymity thresholds. If a group is too small - a tiny team, or a very narrow filter - its eNPS is hidden until enough people respond, so that no individual's answer can be inferred. This is expected behaviour, not an error. If a breakdown looks empty, see Why can't I see results yet?.
The limits of eNPS
eNPS is powerful because it's simple - but that simplicity has trade-offs. Keep these in mind:
- It's a single question. It can't, on its own, tell you why people feel the way they do. That's what your drivers and comments are for.
- The bands are broad. A score of 6 (detractor) and a 7 (passive) are just one point apart on the scale but land in different groups. Small shifts near the boundaries can move the number.
- It's culturally influenced. Rating tendencies differ across regions and cultures, which affects cross-country comparisons.
- It's a snapshot in time. One measurement is noisy; the value comes from tracking it consistently.
None of these are reasons to avoid eNPS - they're reasons to use it alongside your fuller engagement data rather than in isolation.
Frequently asked questions
Is a score of 7 a promoter?
No. On the standard eNPS scale, 7-8 are Passives, 9-10 are Promoters, and 0-6 are Detractors. A 7 is satisfied but not an active advocate.
Why is my eNPS negative if most people gave decent scores?
Because Passives (7-8) don't count toward the score, a workforce that's broadly "fine" but with few genuine enthusiasts and a chunk of detractors can still produce a negative or low number. Lifting Passives into Promoters is the fix.
How often should we measure eNPS?
Often enough to see a trend, but not so often that you cause survey fatigue. Many organizations track it every engagement survey and via lighter pulse surveys in between.
Can I see eNPS for just my team?
Yes - managers can view team-level eNPS in CultureMonkey, and results can be filtered by demographic, provided the group is large enough to meet the anonymity threshold.
Does the open-text follow-up affect the score?
No. The comment is for context only; CultureMonkey calculates the eNPS number purely from the 0-10 ratings.
Where to go next
- See what's behind your number: View the eNPS breakdown
- Understand the fuller picture: Understand the overall engagement score
- No eNPS showing? Why can't I see results yet?
- For candidates: How candidate NPS is calculated in CultureMonkey
eNPS is one number among several. The rest of them, and the comparisons you can draw:
- Add the question: Add the eNPS question to a CultureMonkey survey
- Write your own version: Custom eNPS-style questions in CultureMonkey
- The promoter split: View the eNPS breakdown in CultureMonkey
- By team and over time: View eNPS by demographic and over time in CultureMonkey
- Engagement and eNPS together: Review engagement and eNPS trends in CultureMonkey
- The overall engagement score: Understand the overall engagement score
- Drivers and factors: Understand drivers and factors
- Reading a question score: How to read question scores in a report
- Against your industry: Compare against industry benchmarks in CultureMonkey
- Against your own history: Compare against internal benchmarks in CultureMonkey
- Across regions: Compare scores across regions in CultureMonkey
- A manager's team benchmark: Compare your team to benchmarks in CultureMonkey
Your feedback helps us improve the Help Center.