

Filter reports by demographic and attributes
How to narrow a whole survey report to a subset of employees using team, location, manager, tenure, and custom attribute filters - how filtering differs from grouping, and how anonymity still applies to a filtered view.
On this page
A survey report shows you the whole organization by default: every score, every driver, and every piece of feedback averaged across everyone who responded. That company-wide view is the right place to start, but it rarely tells the full story. The number you really want is often hidden inside it: how do engineers in the Bangalore office feel? What is the eNPS for people in their first year? Are the managers in the Sales org seeing the same drivers as everyone else?
Filtering is how you get there. A filter narrows the entire report down to a subset of employees, so every chart, score, and comment you see afterward reflects only the people who match. This guide covers what you can filter by, how to apply and combine filters, the important difference between filtering and grouping, and why anonymity still protects your people even in a tightly filtered view.
A filter answers "show me the report for only these people." Pick one or more attributes (team, location, manager, tenure, a custom field) and the whole report re-scopes to the employees who match. Filters stack with AND logic across attributes, so the more you add, the smaller and more specific the group gets. Every filtered view in CultureMonkey still obeys the anonymity threshold, so if your filter lands on a group that is too small, the results stay hidden.
What filtering does to a report
When you apply a filter, CultureMonkey rebuilds the report from scratch using only the responses from employees who match. This is a genuine re-scoping, not a highlight. The overall score, the eNPS, the driver breakdown, the participation rate, and the feedback stream are all recalculated against the filtered population.
That is the mental model to hold on to: a filter changes who the report is about. Before you filter, the report is about everyone. After you filter to "Location: London," the report is about the London office and nothing else. Remove the filter and you are back to the whole organization.
Because the recalculation is complete, a filtered score is directly comparable to the unfiltered one. If your company-wide engagement score is 7.4 and the filtered London score is 6.8, that gap is real and meaningful. You are comparing two honestly calculated numbers on the same scale.
What you can filter by
CultureMonkey draws its filters from the same employee data you use to run surveys, split into two families.
Standard attributes are the built-in demographic fields that most organizations share. The default set is:
| Filter | What it scopes to |
|---|---|
| Team | The team an employee belongs to |
| Location | Their office or work location |
| Manager | Who they report to |
| Sub team | A finer division within a team |
| Business unit | A larger organizational grouping |
| Tenure | How long they have been with you (e.g. 0-1 year, 1-3 years) |
| Gender | Employee gender, where captured |
| Employee type | Full-time, part-time, contractor, and so on |
Depending on how your account is configured, you may also see Region, Country, and Business group as standard filters. An Account Admin can also curate which of these appear, and can set different sets for admins, sub admins, and managers, so the exact list you see is tailored to your account and role.
Custom attributes are the fields your organization defined itself when importing employees: pay band, department code, cohort, job family, shift, or anything else you track. Any custom attribute that has been mapped to enough employees becomes available as a filter automatically. There is no separate setup step for reporting: if the data is on your employee records, it is filterable.
An attribute only appears as a filter option if at least three employees share a value for it. A custom field that has been filled in for just one or two people will not show up as a filter. This prevents you from accidentally building a filter so specific that it points at a single person.
Applying a filter, step by step
Filters live at the top of a survey report, so you can re-scope without leaving the page.
- 1Open the report - go to Analyse > Reports and open the survey you want to explore.
- 2Open the filter controls - find the filter or demographic controls at the top of the report.
- 3Choose an attribute - pick what you want to narrow by, for example Location.
- 4Choose one or more values - select London, or select London and Manchester together. Many filters let you pick several values at once.
- 5Apply - the whole report reloads and now reflects only the employees who match.
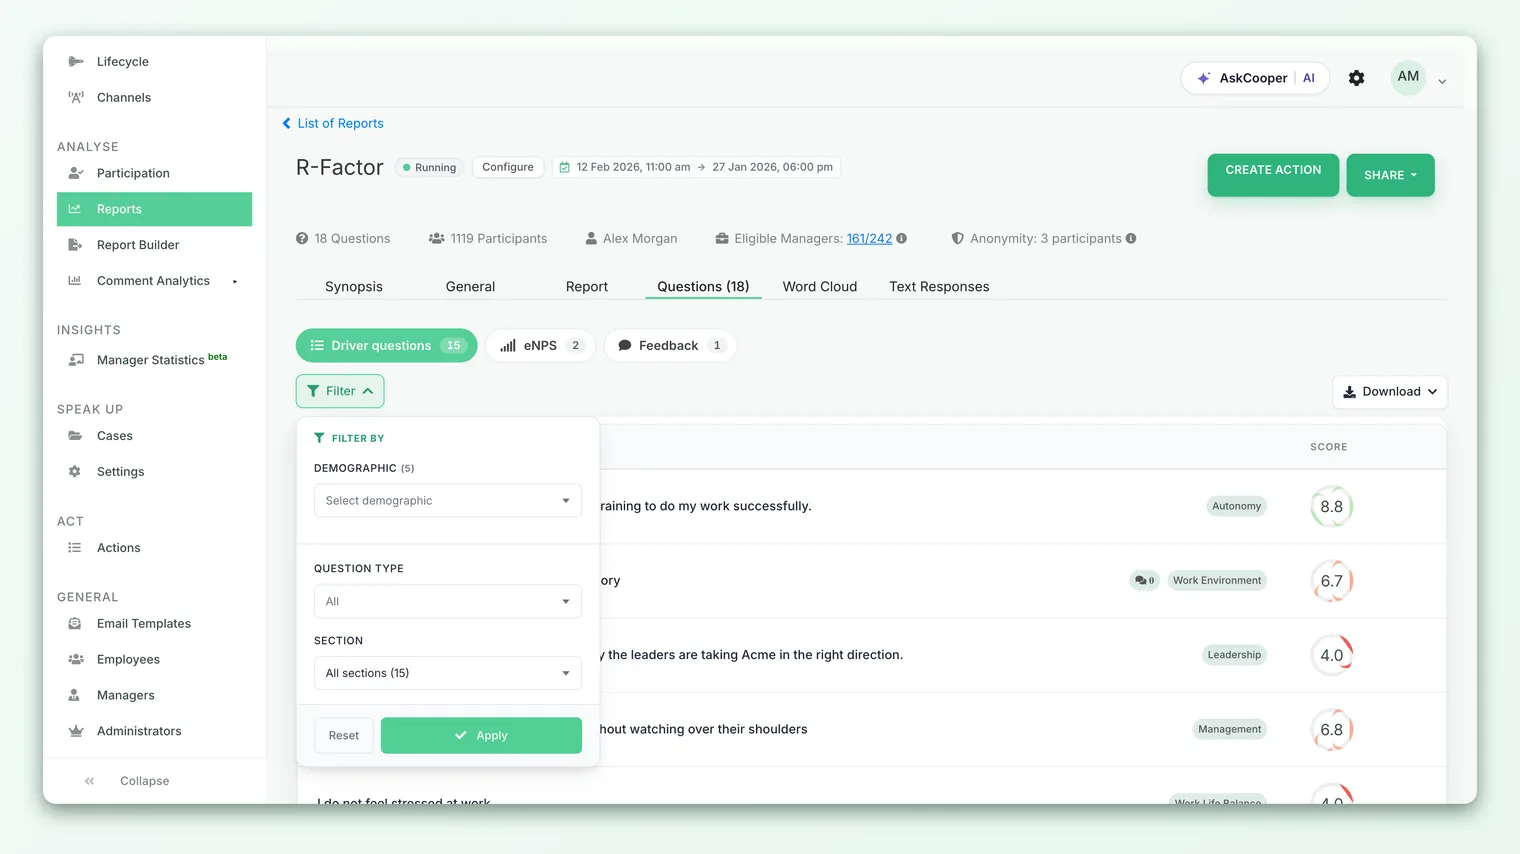
To go back to the full picture, clear the filter (or set the attribute back to "All") and the report returns to the whole organization.
Combining filters: how the logic works
You are not limited to one filter at a time, and understanding how multiple filters combine is the difference between a useful query and a confusing empty one.
Across different attributes, filters combine with AND. Add a Team filter and a Location filter and you get only the employees who match both: for example, employees who are in the Sales team and in the Berlin office. Each attribute you add makes the group smaller and more specific.
Within a single attribute, multiple values combine with OR. If a filter lets you pick several values at once (say Location: London and Manchester), you get everyone in either of those locations. This widens the group rather than narrowing it.
Putting those two rules together, a filter like "Team is Sales, Location is London or Manchester" reads as: in Sales, and in (London or Manchester). That is a precise, sensible slice. The practical takeaway is simple: adding attributes narrows, adding values within one attribute widens. If a filtered report comes back empty, you have almost certainly stacked enough conditions that no single employee satisfies all of them at once.
For richer, saved, multi-attribute filters built on your custom fields, see Build advanced filters with custom attributes.
Filtering vs grouping: the key distinction
This is the concept people most often mix up, and getting it right will change how you read every report.
Filtering narrows to a subset. It hides everyone who does not match and shows you a single report about the people who remain. After filtering to "Location: London," you see one set of numbers: London's.
Grouping keeps everyone but splits them side by side. Instead of choosing one location, grouping by Location shows you every location at once, each with its own score, laid out for comparison. Nobody is hidden; the population is simply broken into buckets so you can compare them.
| Filtering | Grouping | |
|---|---|---|
| Question it answers | What is the score for this specific group? | How do all the groups compare to each other? |
| Who you see | Only the employees who match | Everyone, split into buckets |
| Result | One re-scoped report | Many scores side by side |
| Best for | Investigating one segment in depth | Spotting which segments are strong or weak |
The two work beautifully together. A common workflow is to group first to find the outlier, then filter to investigate it. Group the eNPS by Location, notice that Manchester is trailing, then filter the whole report to Manchester and read its drivers and comments to understand why. Grouping tells you where to look; filtering lets you look closely. To compare segments side by side, see Group scores by demographic.
Anonymity in a filtered view
Filtering makes it easy to zoom in on a small group, so this is exactly where anonymity protection matters most, and CultureMonkey applies it automatically.
Every score and breakdown in a filtered report still has to clear your account's anonymity threshold before it will display. The threshold is the minimum number of responses a group must have for its results to be shown. The default minimum is three responses, and many accounts set it higher (a common value is five) for extra protection. Whatever your threshold, it applies to the filtered population, not the whole company.
The practical effect is that a filter can succeed at selecting people yet still show no numbers. If you filter to "Location: Dublin, Tenure: 0-1 year" and only two matching employees responded, the report will not reveal their scores or comments. This is not a bug or a data problem. It is the platform refusing to expose results for a group so small that an individual's answer could be inferred. The narrower your filter, the more likely you are to run into this, which is a healthy pressure toward keeping segments large enough to stay anonymous.
If a filtered report looks empty, the most common causes are that too few people in that group responded to clear the anonymity threshold, or that you have stacked so many filters together that almost no one matches. Loosen the filter (remove an attribute or widen a value) and the results usually reappear. See Why can't I see results yet?.
Who can filter, and what they can filter
What you can filter by depends on your role, because filtering never overrides the data boundaries of your account.
- Account and survey admins typically see the full range of standard and custom attributes and can filter across the entire organization.
- Sub admins filter within the slice of the organization they administer, and may see a curated attribute list configured for their role.
- Managers can filter the reports they are entitled to see, scoped to their own team or reporting line. A manager filtering by Location still only ever sees their own people within that location, never the whole office.
In other words, a filter narrows what you are already allowed to see. It cannot widen your access. An Account Admin can also decide which standard attributes are available as filters for each role, so the exact options differ from account to account by design.
Best practices
- Start wide, then narrow. Read the whole-organization report first so you know the baseline, then filter to understand a specific group against it.
- Group to find, filter to explain. Use grouping to spot which segment stands out, then filter to that segment to read the drivers and comments behind it.
- Add one attribute at a time. Stacking three filters at once is the fastest way to an empty report. Add them one by one and watch the population shrink.
- Mind the threshold. If you are filtering to a small team, expect some views to be hidden. That is the anonymity promise working, not a failure.
- Compare like with like. A filtered score is directly comparable to the unfiltered one, so use that gap as a real signal, not an artifact.
Frequently asked questions
Does filtering change the underlying scores?
No. Filtering only changes which responses are included in what you see. CultureMonkey recalculates every number live from the matching responses; nothing about the stored data or anyone else's report changes.
Why does my filtered report show no results?
Almost always one of two reasons: the matching group is smaller than your anonymity threshold, so results are hidden to protect individuals, or you have combined so many filters that very few or no employees satisfy all of them. Widen or remove a filter and results typically return. See Why can't I see results yet?.
What is the difference between filtering and grouping again?
Filtering shows one report about a subset (everyone else is hidden). Grouping shows everyone at once, split into buckets you can compare side by side. Filter to go deep on one group; group to compare many.
Can I filter by a custom field we uploaded?
Yes. CultureMonkey automatically makes any custom attribute mapped to at least three employees available as a filter, with no extra reporting setup. For building saved, multi-attribute filters on custom fields, see Build advanced filters with custom attributes.
If I filter to my own team, will I see individual answers?
No. Team-level filtering still obeys the anonymity threshold. You see aggregated scores and anonymized feedback for the group, never a specific person's response, and if the group is too small to clear the threshold you will see nothing at all.
Can I combine standard and custom attributes in one filter?
Yes. Standard and custom attributes can be mixed in a single filter, combining with AND logic just like any other attributes. This is where the advanced filter builder is most useful.
Where to go next
- Build reusable, multi-attribute filters: Build advanced filters with custom attributes
- Compare segments side by side instead of narrowing: Group scores by demographic
- Filtered view looks empty? Why can't I see results yet?
Your feedback helps us improve the Help Center.