

Group question scores by demographic
How to break a single question's score down by team, location, manager, or a custom attribute - applying a grouping, reading the grouped table, and understanding why small groups are hidden by the anonymity threshold.
On this page
A single company-wide score for a question is a useful headline, but it hides as much as it reveals. A question that averages a comfortable 7.8 across the whole organization might be a 9.1 in one region and a 5.4 in another. Grouping a question's score by demographic is how you find that difference. It splits the one number into a row for each team, location, manager, or custom attribute value, so you can see exactly where a question lands well and where it needs attention.
This guide covers how grouping works in CultureMonkey: how to apply a grouping to a question, how to read the grouped table, how the score for each group is calculated, and - importantly - how the anonymity threshold quietly hides groups that are too small to report on safely.
Open any rating question in a survey report and choose a group by demographic (team, location, manager, custom attribute, and more). CultureMonkey shows one row per group with that group's average score and its response count, sorted so the largest groups appear first. Any group with fewer responses than the survey's minimum is hidden entirely, so no individual's answer can be inferred.
What "group by demographic" means
Every employee in CultureMonkey carries a set of attributes: which team they sit in, their location, their manager, their sub-team, business unit, and business group, plus profile fields like tenure, gender, and employee type, and (if your account enables them) region and country. On top of those standard fields, your account can define custom attributes - anything from "Department" to "Shift" to "Cost Center."
Grouping takes one question and pivots its responses across one of those attributes. Instead of a single average, you get a small table: one row per attribute value, each showing that group's own score and how many people it is based on. The underlying responses are the same; you are just looking at them sliced a different way.
This is different from filtering. A filter narrows the whole report to a subset (for example, "only show me the Sales team"). Grouping keeps everyone in view but breaks the score apart by attribute so you can compare groups side by side. The two work together: you can filter a report to one location and then group the remaining responses by team. For more on narrowing a report, see Filter reports by demographic.
Applying a grouping to a question
Grouping lives inside the detail view for a single question, not on the report summary. To get there:
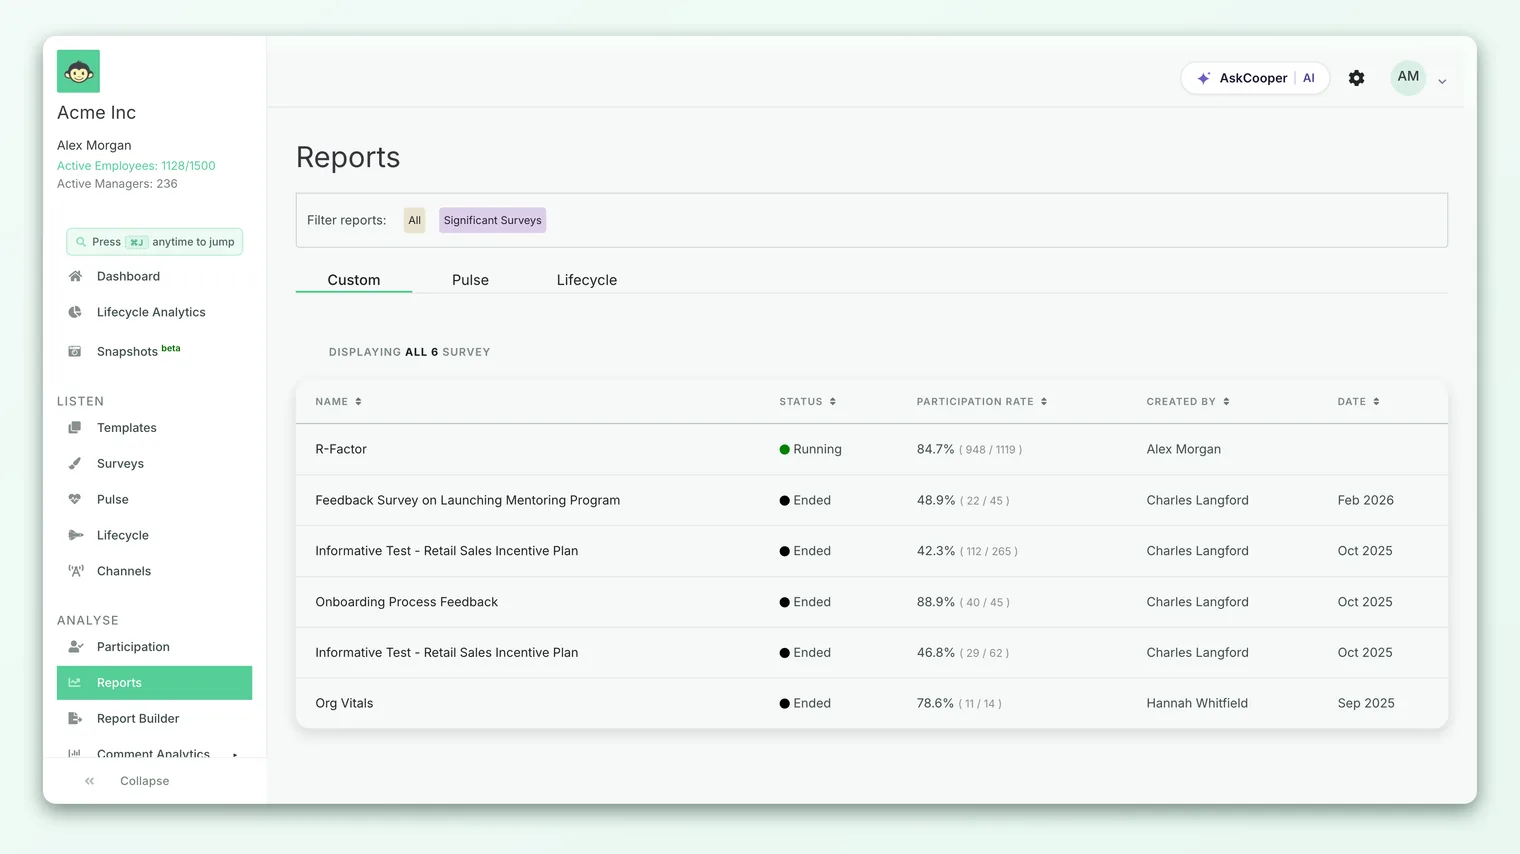
- 1Open a survey report - go to Analyse › Reports and open the survey you want to look at.
- 2Open a question - from the Questions view, click into the specific rating question you want to break down. Grouping is available for rating questions, since those produce a numeric score to average.
- 3Choose a "group by" demographic - use the group-by selector on the question and pick the attribute you want to split by (for example, Location). The grouped table refreshes to show one row per value.
- 4Search within a large demographic - when a demographic has many values (hundreds of managers, say), use the search box to jump to the ones you care about instead of scrolling.
Only rating questions can be grouped this way. Open-text and other non-rating question types don't produce a score to average, so the group-by option applies to the rating questions in your survey.
Reading the grouped table
Each row in the grouped table describes one value of the demographic you chose. There are three things worth reading in every row:
| Column | What it tells you | How to use it |
|---|---|---|
| Group name | The team, location, manager, or attribute value | Identifies which slice of the org the row represents |
| Score | That group's average answer to this question | Compare against the overall score and against other groups |
| Responses (count) | How many people in that group answered | Tells you how much weight to give the score |
The response count matters more than people expect. A group of 4 people scoring 5.0 and a group of 400 people scoring 5.0 are not equally meaningful. The small group's number can swing wildly if even one person answers differently next time, while the large group's number is stable. Always read the score and the count together.
Rows are sorted by response count, largest first, so your biggest, most statistically solid groups sit at the top and the long tail of small groups falls below. That ordering is deliberate: it puts the most reliable signal where your eye lands first.
The single most useful move is to compare each group's score to the question's overall score. Groups sitting well below the average are your hotspots; groups well above it are worth learning from. The gap between the highest and lowest group is often more revealing than the headline number itself.
How each group's score is calculated
The number in each row is the average of that group's answers to this one question, expressed on your account's reporting scale.
Under the hood, CultureMonkey takes every response to the question from people in that group, averages the raw values, and then presents the result on whatever scale your account uses:
- A 0 to 5 scale shows the raw average directly.
- A 0 to 10 scale shows the raw average doubled.
- A percentage view multiplies it up to a 0 to 100 figure.
Whichever scale you see, the ranking of groups relative to each other is identical; only the presentation changes. So a group that scores highest on a 0 to 5 view is also highest on the percentage view. For a full explanation of how the raw values become a score, see How question scores are calculated.
A worked example
Suppose a question - "I have the tools I need to do my job well" - has an overall score of 7.6 on a 0 to 10 scale. You group it by Location and get:
| Location | Score | Responses |
|---|---|---|
| Bangalore | 8.4 | 210 |
| London | 7.9 | 95 |
| New York | 7.1 | 88 |
| Austin | 5.2 | 41 |
The overall 7.6 looked healthy, but grouping tells the real story: Austin is more than three points below Bangalore and well under the average. That is where a tooling or equipment problem is most likely hiding, and it is where a conversation or an action plan will do the most good. Without grouping, Austin's signal was buried under the larger, happier sites.
Why some groups are missing: the anonymity threshold
If you group by a demographic and notice that some values you expected are simply not there, that is almost always the anonymity threshold doing its job, not a bug.
CultureMonkey protects respondents by refusing to report on any group that is too small. Before it shows the grouped scores, it counts how many people responded in each group and drops any group whose response count is below the survey's minimum. Those groups never appear in the table at all - they are excluded before the scores are even calculated. This stops anyone from narrowing a view down to a handful of people and inferring who said what.
The minimum is the survey's "Minimum responses required to report data" setting, chosen when the survey was built. A couple of things are worth knowing about it:
- For anonymous surveys, the minimum can never drop below 3. Even if a lower number were entered, CultureMonkey raises it to the floor of 3 to keep responses genuinely anonymous.
- For non-anonymous surveys, the floor comes from your account's minimum-responses setting (commonly 3, though it can be configured lower).
- The threshold is locked once the survey launches. You cannot loosen it mid-flight to reveal a small group, which is exactly the point: the privacy promise made to respondents at launch is kept.
A missing group does not mean nobody there responded or that they scored badly. It only means the number of responses fell below the threshold, so the score is withheld. As more people in that group answer and it crosses the minimum, it will appear on its own.
This is the same anonymity protection that applies everywhere else in CultureMonkey, including heatmaps, driver scores, and eNPS. If a whole breakdown looks emptier than you expected, or a group vanished after you added a filter, it is usually because the filtered slice pushed one or more groups under the threshold. See Why can't I see results yet? for the full picture.
How filtering interacts with the threshold
Filtering and grouping stack, and that combination is the most common reason a group disappears. Suppose the Austin location has 41 respondents overall - comfortably above the threshold - so it shows when you group by Location. But if you first filter the report to "tenure: less than 6 months" and then group by Location, Austin's eligible population might fall to just 2 people. At that point Austin drops out of the grouped table, because within that filtered slice it is now too small to report on safely.
The takeaway: the count that matters is the count after any filters are applied, not the group's total headcount. The more you narrow a report, the more groups will fall below the line.
Best practices
- Read score and count together. Never act on a group's score without glancing at how many people it represents. A dramatic number on a tiny group is noise as often as signal.
- Start with the widest split, then drill in. Group by a broad attribute (location or business unit) first to find where the variation lives, then group by a finer one (team, then manager) inside the interesting area.
- Compare groups to the overall, not to perfection. The useful question is "which groups are meaningfully below our own average?", not "which groups fall short of 10?"
- Expect small groups to be hidden, and design around it. If you routinely need results for small teams, that is a reason to review your survey's minimum-responses setting before the next launch, not to try to force it open afterward.
- Pair the grouped scores with comments. Scores tell you where; open-text feedback tells you why. Once grouping points you at a struggling group, read that group's comments to understand the cause.
Limitations to keep in mind
- Rating questions only. Grouping needs a numeric score to average, so it applies to rating questions rather than open-text or other formats.
- Small groups are withheld by design. You cannot reveal a below-threshold group, and you would not want to - that suppression is what makes honest answers possible.
- Custom attribute values must be populated. Grouping by a custom attribute only works for employees who actually have a value for it. People with the field left blank won't form a group.
- Grouping is one dimension at a time. A single grouped table splits by one attribute. To combine dimensions (team within location, for instance), use a filter for one and group by the other.
Frequently asked questions
Why don't I see a group I know exists?
Almost certainly because its response count is below the survey's minimum-responses threshold, so CultureMonkey hides it to protect anonymity. This is especially common after you have applied a filter, which shrinks each group's eligible population. It can also happen if that group's employees have no value set for the attribute you grouped by.
Is the group score the same number I would get by filtering to that group?
Yes. Grouping by an attribute and filtering the report down to a single value of that attribute produce the same score for that group, because both average the same underlying responses. Grouping just shows every value at once instead of one at a time.
Can I change the anonymity threshold to see a hidden group?
Not after launch. The minimum-responses setting is fixed when the survey goes live and cannot be lowered mid-survey. For anonymous surveys it can never go below 3 regardless. Plan the threshold before launch if you need results for smaller groups.
Why are the groups ordered the way they are?
CultureMonkey sorts grouped rows by response count, largest first, so the most statistically reliable groups appear at the top and small, noisier groups fall to the bottom.
Does grouping change the question's overall score?
No. The overall score is the average across everyone who answered. Grouping just redistributes those same responses into per-group rows; it never changes the headline number.
Where to go next
- Understand the number itself: How question scores are calculated
- Narrow a report to a subset: Filter reports by demographic
- A breakdown looks empty? Why can't I see results yet?
Your feedback helps us improve the Help Center.