

Build custom reports with the CultureMonkey Report Builder
A complete guide to the Report Builder in CultureMonkey - where to find it, the report types available (standard, heatmap, confidential, text, and eNPS), how to configure one, and how to generate and download your file.
On this page
The interactive Reports panel is where most day-to-day analysis happens - scores, trends, filters, and drill-downs, all on screen. But sometimes you need the underlying data in a spreadsheet: a distribution to hand to leadership, a heatmap to slice in Excel, or every open-text comment in one file. That's what the Report Builder is for.
The Report Builder is a curated library of ready-made, downloadable report formats. Instead of building an export from scratch, you pick a survey, choose the report type that matches what you need, and download a file. This guide covers where to find it, the report types available, how to configure and generate one, and the things to watch for along the way.
The Report Builder lives under Analyse > Report Builder. Pick a survey, then choose a report type - standard (rating distribution), heatmap (driver scores by manager or team), confidential (responses with employee names), text (all open-text answers), or eNPS (promoter and detractor cuts). Click Download. CultureMonkey generates large reports in the background and emails them to you.
Where the Report Builder lives
The Report Builder sits in the left-hand navigation under the ANALYSE section, just below Reports. Look for the Report Builder entry with the export icon.
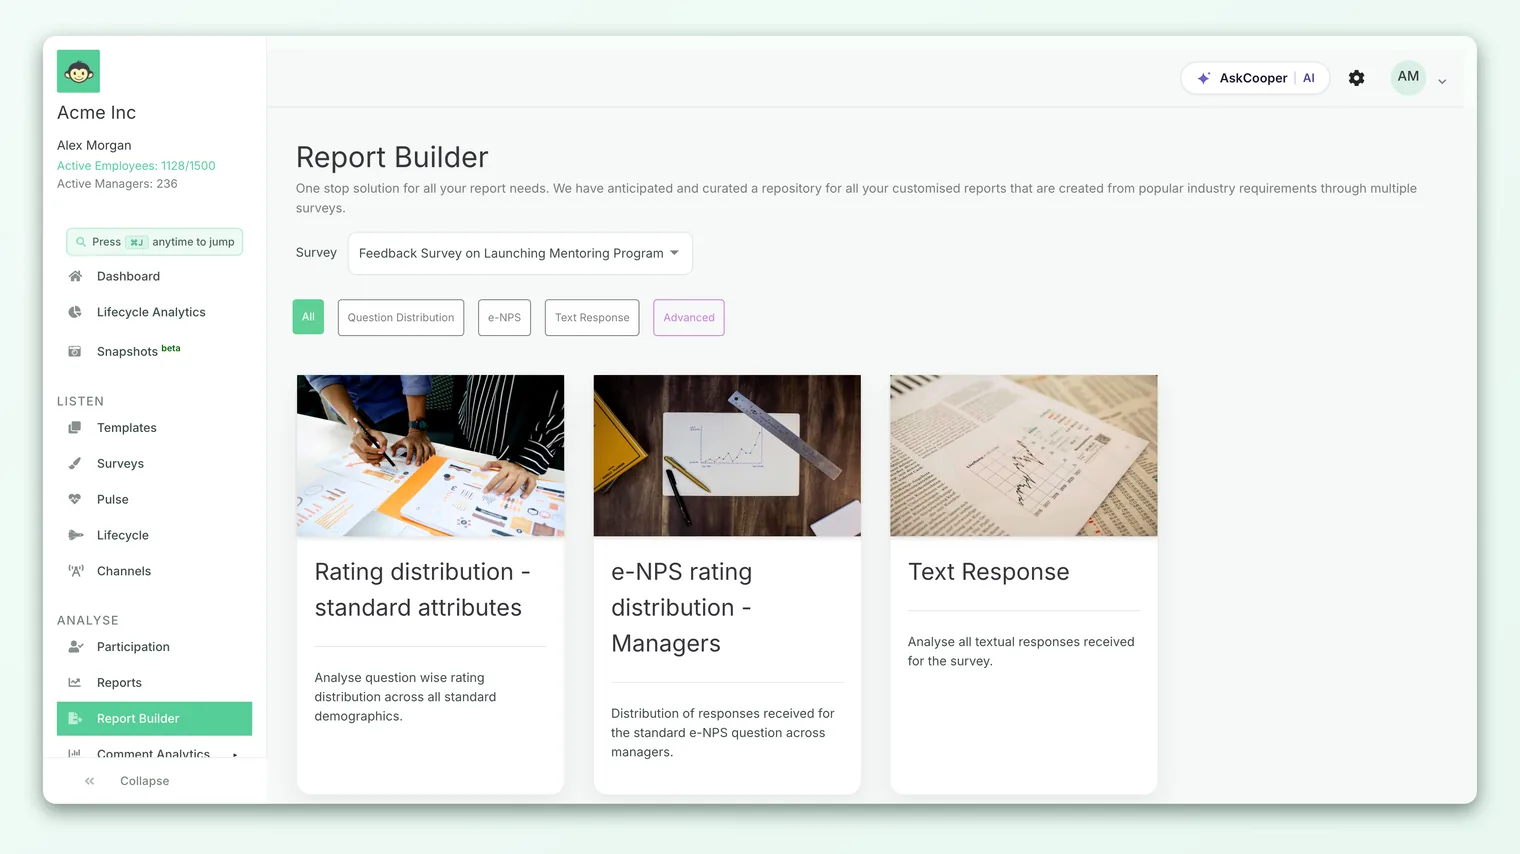
The header describes it well: it's a "one stop solution for all your report needs," a curated repository of report formats built from common, real-world requirements. Rather than reinventing an export each time, you reach for a template that already does the aggregation you want.
A couple of things to know before you dive in:
- It's permission-gated. The Report Builder only appears if your role can view report tools. In practice that means Survey Admins and equivalent roles. Managers and employees don't see it. If the entry is missing from your navigation, you don't have access - talk to your account admin.
- It only lists report-ready surveys. The survey picker shows surveys that have closed and reached the point where results are available, including both custom engagement surveys and lifecycle surveys. A survey that's still collecting responses, or that hasn't crossed its anonymity threshold, won't appear yet. If the page tells you there are no report-ready surveys, that's why.
Step one: pick your survey
Everything in the Report Builder is scoped to a single survey. At the top of the page you'll find a Survey dropdown listing your report-ready surveys, most recent first.
Choose the survey you want to report on before anything else. This matters because the survey you pick changes which report types are available. The Report Builder inspects the survey and hides report types that wouldn't make sense for it:
- If the survey has no rating questions, the heatmap (driver score) reports are hidden - there are no driver scores to build a heatmap from.
- If the survey doesn't have eNPS enabled, the eNPS report types are removed from the list.
- The confidential report only appears when your account is configured to show employee names.
So if you're missing a report type you expected, the first thing to check is which survey is selected and what that survey actually contains.
The report types available
Once you've selected a survey, the Report Builder shows a grid of report cards. Each card has a title, a short description, and a Download button that appears when you hover. The reports fall into a handful of families, grouped by tag so you can filter them.
Here's how they break down.
| Report family | What it gives you | Good for |
|---|---|---|
| Standard (rating distribution) | Question-by-question rating distribution across all standard demographics | A clean, spreadsheet view of how each question scored |
| Heatmap (driver scores) | Driver score distribution across managers or across teams | Comparing engagement drivers side by side by group |
| Confidential (with names) | Every submitted response tied to the employee's name and attributes | Named follow-up in non-anonymous surveys |
| Text response | All open-text answers received for the survey | Reading and coding qualitative feedback in bulk |
| eNPS | Promoter and detractor cuts across managers, teams, sub-teams, locations, and business units | Slicing advocacy by demographic |
Let's look at each in turn.
Standard: rating distribution
The Rating distribution - standard attributes report analyzes each rating question and shows how responses were distributed across all of your standard demographics (team, location, and so on). This is the workhorse export: if someone asks for "the survey results in a spreadsheet," this is usually what they mean. It gives you the numbers behind the on-screen scores without any custom attributes layered in.
Heatmap: driver scores by manager or team
There are two heatmap reports:
- Driver scores - managers breaks the driver score distribution down across managers, with manager IDs.
- Driver scores - teams does the same across teams.
These are the downloadable cousins of the on-screen heatmap. A heatmap lays out engagement drivers (rows) against groups (columns) so you can spot at a glance where a driver is strong and where it's weak. Downloading the data lets you sort, re-color, and pivot it in your own tool. If the heatmap view itself is new to you, read How to read a heatmap first - the download makes far more sense once you understand the layout. Remember these two reports only appear when the survey has rating questions.
Confidential: responses with employee names
The Confidential Report with employee names contains all submitted responses along with each employee's standard and custom attributes - and, crucially, their name. This is the one report that deliberately breaks anonymity, so it comes with guardrails:
- It's marked as a Confidential report and is only offered for surveys that were run in confidential (non-anonymous) mode.
- It only appears at all if your account is set up to show employee names.
Because it links responses to individuals, treat this file as sensitive. Use it only where named follow-up is the whole point (for example, a lifecycle survey where you need to route responses back to the right person), and store and share it accordingly.
The confidential report identifies individual respondents by name. Only run it on genuinely non-anonymous surveys, download it to a secure location, and never share it more widely than you have to. If a survey was promised as anonymous, this report is simply not available for it, by design.
Text response: all open-text answers
The Text Response report pulls together every textual answer received for the survey into a single file. If you have open comment questions, or an eNPS follow-up like "what's the main reason for your score?", this is how you get all of that qualitative feedback in one place to read, theme, and code. It's especially useful when you want to run comments through your own analysis rather than reading them one screen at a time.
eNPS: promoter and detractor cuts
If the survey has eNPS enabled, you'll see a set of eNPS reports that slice advocacy by demographic:
- eNPS rating distribution - Managers shows the spread of eNPS responses across managers.
- eNPS Promoters & Detractors reports break out promoters and detractors across teams, sub-teams, locations, business units, and managers.
Each one answers the same question - where is advocacy strong and where is it weak - cut by a different dimension. Depending on your account configuration, you may also see a combined NPS Rating Distribution - Location, Business Unit, Team report that layers those cuts together in a single file.
Filtering the library with tags
If the grid feels busy, use the tag pills above it to narrow the list. The tags mirror the families above - Question Distribution, Heatmap Distribution, eNPS, and Text Response - plus an All tab that shows everything. Clicking a tag filters the cards to just that group, which is the fastest way to find, say, all the eNPS cuts at once.
Some accounts also have an Advanced tab. This is where more powerful, self-serve builders live when they're enabled for your account:
- NPS Wizard generates every combination of Net Promoter Scores for the dimensions you choose.
- Dynamic Reports lets you build a personalized report by selecting engagement metrics and stacking multiple layers of dimensions.
Both are marked beta and are only available when your account has them turned on, so the Advanced tab won't appear for everyone. If you'd like access, ask your account admin.
Configuring and generating a report
Configuration in the Report Builder is intentionally light. The report formats are pre-built, so you're really making two choices - which survey and which report type - and the tool handles the rest.
- 1Open the Report Builder - go to Analyse > Report Builder in the left navigation.
- 2Select the survey - use the Survey dropdown at the top to choose the survey you want to report on. This drives which report types are shown.
- 3Filter if you like - click a tag to narrow the grid to a report family (or leave it on All).
- 4Pick the report - find the card that matches what you need and read its description to confirm it's the right cut.
- 5Download - hover over the card and click Download on the report you want.
Generating and downloading your file
What happens after you click Download depends on how large the report is.
- Smaller reports download directly. The file is built on the spot and downloads to your browser as a CSV (or spreadsheet) attachment. You can open it right away.
- Larger reports are generated in the background. For heavier reports - the standard distribution, the manager heatmap, the confidential report, the text response report, and the multi-level NPS cut - CultureMonkey builds the file in the background and emails it to you when it's ready, rather than making you wait on the page. You'll see a confirmation message telling you the report is being prepared.
In that background case, the message is clear about timing: the report is being generated and will be emailed to you shortly, and if it doesn't arrive within about 30 minutes you should check your spam folder or reach out to support. This split keeps the interface responsive even for surveys with a lot of data.
Background reports are emailed to the address on your CultureMonkey account. If you don't see the file, check that mailbox (and its spam folder) specifically, rather than a shared or forwarding address.
Report Builder vs the Reports panel
The Report Builder and the on-screen Reports panel solve different problems, and it's worth being clear on when to reach for each.
| Report Builder | Reports panel | |
|---|---|---|
| Format | Downloadable files (CSV / spreadsheet) | Interactive, on-screen views |
| Best for | Handing data to others, offline analysis, bulk comment review | Exploring, filtering, and drilling into results live |
| Configuration | Pick a survey and a pre-built report type | Apply filters, segments, and comparisons interactively |
| Sharing | A file you send | A PDF export or a shared link |
A simple rule of thumb: explore in the Reports panel, and when you need the numbers in a file to work on elsewhere, come to the Report Builder. If what you actually want is a polished, presentation-ready document rather than raw data, the Export a report to PDF flow is usually the better fit.
Best practices
- Pick the survey first. Because the available report types depend on the selected survey, always confirm the survey before hunting for a report type. A "missing" report is almost always a survey that doesn't have that data.
- Match the report to the audience. Leadership usually wants the standard distribution or a heatmap; a people team digging into comments wants the text response report; anonymity-sensitive contexts should steer well clear of the confidential report.
- Respect anonymity. The confidential report is the only one that names individuals, and it's gated for a reason. Everything else is aggregated. Don't try to reverse-engineer identities from small groups.
- Give big reports time. If you're told a report is being emailed, don't re-click repeatedly. It's already being built. Give it a few minutes.
Frequently asked questions
Why don't I see the Report Builder in my navigation?
Access is permission-gated to roles that can view report tools, typically Survey Admins. If it isn't in your left navigation under Analyse, you don't have access. Ask your account admin about your role.
Why is a report type I expected missing from the grid?
The list adapts to the selected survey. Heatmap reports need rating questions, eNPS reports need eNPS enabled, and the confidential report needs both a non-anonymous survey and an account configured to show employee names. Check the survey you've selected first.
Which format do the reports download in?
Most reports download as a CSV or spreadsheet file. Larger reports are generated in the background and emailed to you rather than downloaded directly in the browser.
My report never arrived. What do I do?
Background reports are emailed when ready. If it's been more than about 30 minutes, check the spam folder of the mailbox on your CultureMonkey account. If it's still missing, contact support@culturemonkey.io.
Can I choose the columns or fully customize a report?
The core report types are pre-built formats, so customization is limited to choosing the survey and the report cut. If your account has the Advanced tab (NPS Wizard and Dynamic Reports, both beta), those tools let you build more tailored, multi-dimension reports.
Is the Report Builder the same as exporting a PDF?
No. The Report Builder produces data files (CSV or spreadsheet) for analysis. To create a polished, shareable document of a report view, use Export a report to PDF instead.
Where to go next
- Explore results on screen: Explore a survey report
- Create a shareable document: Export a report to PDF
- Understand the heatmap layout: How to read a heatmap
Your feedback helps us improve the Help Center.