

View your team's strengths and focus areas
How the My strengths and Focus areas panels on your manager dashboard surface your top and bottom drivers, the score thresholds behind them, and how to turn a focus area into a concrete action.
On this page
Your manager dashboard does more than show you a single engagement number. Two panels near the top, My strengths and Focus areas, translate all of your team's survey answers into a short, ranked list of what's working and what needs attention. Instead of reading a whole heatmap, you get a quick answer to the two questions every manager asks: where are we strong, and where should I put my energy next?
This guide explains exactly what those two panels show, how CultureMonkey decides which drivers count as a strength or a focus area, the score thresholds that sit behind them, and how to turn a focus area into a real, owned action.
My strengths lists your highest-scoring drivers; Focus areas lists your lowest-scoring ones. CultureMonkey shows up to five drivers in each panel, ranked by their average score across every rating question in your surveys. A driver only appears as a strength if it scores at or above the strength threshold, and only as a focus area if it scores at or below the weakness threshold. Both panels respect anonymity, so they stay hidden until enough of your team has responded.
What the two panels show
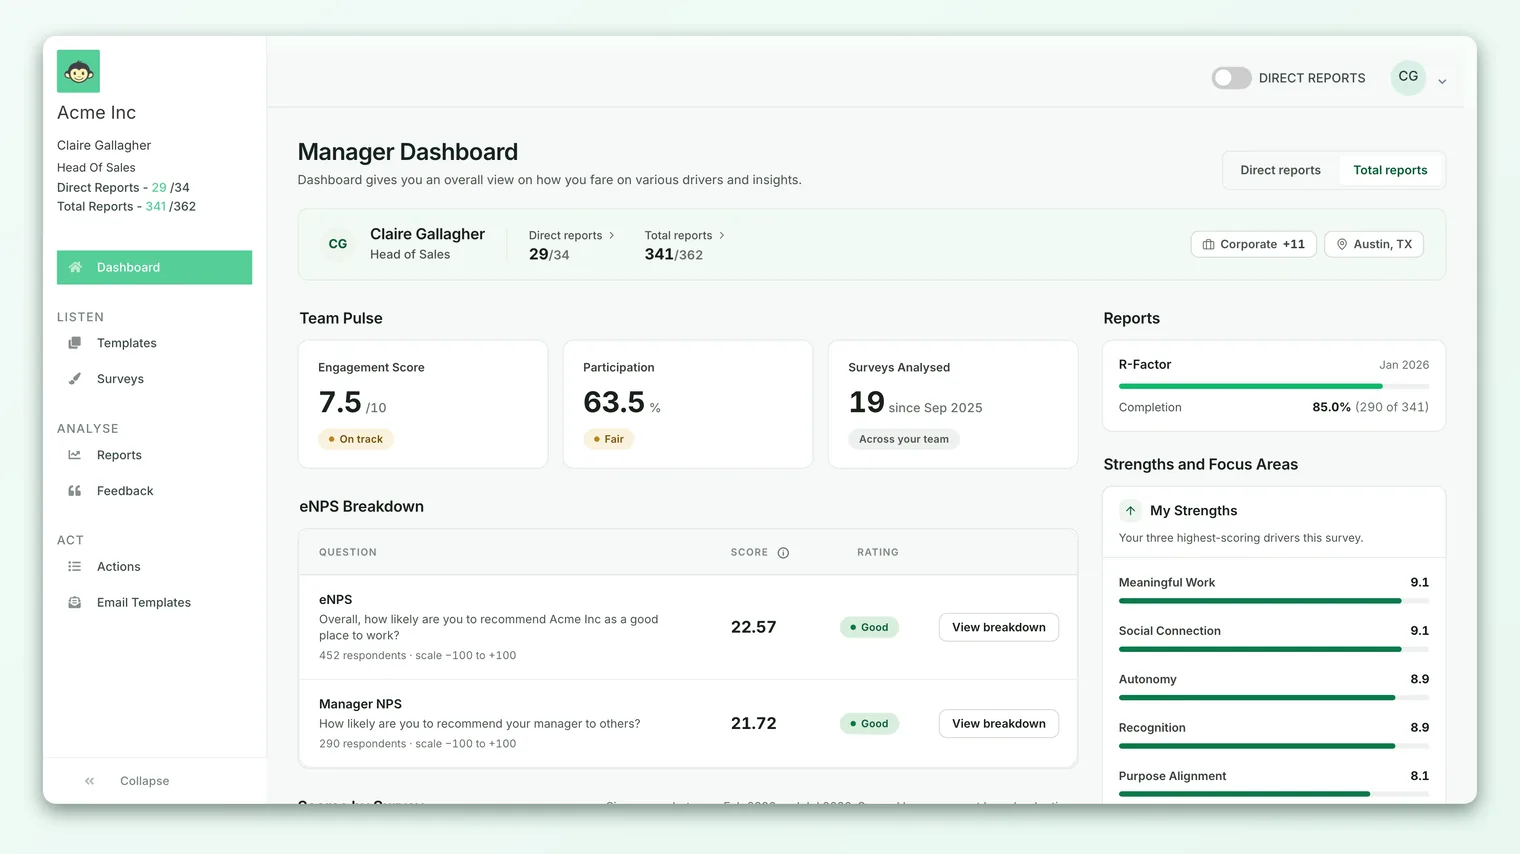
Both panels live on your manager dashboard (the personalized view you land on as a people manager, distinct from the org-wide reports). You'll find them alongside your overall metrics and scores-over-time. For the full tour of everything on that page, see Manager dashboard overview.
Each panel is a ranked list of drivers. A driver is a theme that groups related survey questions together (for example Recognition, Manager relationship, Growth, or Work-life balance). If drivers are new to you, Drivers and factors explained covers how questions roll up into driver scores.
- My strengths shows your highest-scoring drivers - the themes your team rates most positively. The panel describes them as "your highest-scoring drivers across every rating question in your surveys."
- Focus areas shows your lowest-scoring drivers - the themes with the most room to improve. The panel describes them as "drivers with the most room to improve, where your attention moves the needle."
Every row shows the driver's icon, its name, a horizontal bar that fills in proportion to the score, and the numeric score itself. Strengths are styled with an upward arrow and a positive color; focus areas with a downward arrow. It's designed to be read in seconds.
How CultureMonkey picks the drivers
The two lists aren't hand-curated. They're calculated from your team's responses each time the dashboard loads. Here's the logic, step by step.
- 1Average every driver. For each driver, CultureMonkey takes the average of every rating-question answer your team gave, across all of the surveys that feed your dashboard. That produces one score per driver.
- 2Rank both directions. The drivers are sorted by that average - highest first for strengths, lowest first for focus areas.
- 3Apply the thresholds. A driver only qualifies as a strength if its score is at or above the strength threshold, and as a focus area if it's at or below the weakness threshold. Middling drivers may appear in neither panel.
- 4Take the top five. Each panel shows at most the five qualifying drivers at the extreme end. So My strengths is your top five (that also clear the strength threshold), and Focus areas is your bottom five (that also fall under the weakness threshold).
Because both lists come from the same averaged driver scores, a driver can never appear in both panels at once. And because scoring spans every rating question in your surveys, these panels reflect your team's cumulative sentiment, not just the most recent pulse.
If only two of your drivers clear the strength threshold, you'll see two strengths, not five. The panels show qualifying drivers, so a short list is a signal in itself: it usually means your scores are clustered in the middle rather than spread to the extremes.
The score thresholds
The thresholds are the dividing lines that decide whether a driver is "good enough" to be a strength or "low enough" to be a focus area. They adapt to how your account displays scores, so the exact numbers depend on your scoring scale.
| Score scale | Strength threshold (at or above) | Focus area threshold (at or below) |
|---|---|---|
| 0-10 scale (default) | 8.0 | 7.0 |
| 0-5 scale | 4.0 | 3.0 |
| Percentage | 80 | 70 |
A few things follow from this design:
- There's a deliberate gap in the middle. On the 0-10 scale, a driver scoring 7.5 is above the focus-area line but below the strength line, so it appears in neither panel. That gap keeps both lists meaningful: strengths are genuinely strong, and focus areas are genuinely low.
- The bands scale with your account. If your account shows scores out of 5 or as percentages, the thresholds shift to match, so the meaning of a strength (roughly the top of the range) stays consistent however you view numbers.
- Ties break by rank. When more than five drivers qualify, the panel keeps the five most extreme (highest for strengths, lowest for focus areas).
Reading a strength
A strength is a driver your team is telling you they're happy with. Recognition, autonomy, a good relationship with you as their manager - whatever sits at the top of the list is a genuine asset.
Strengths are easy to skim past, but they're worth a moment of attention for two reasons:
- Protect them. Strengths can quietly erode. A driver that's strong today can slip after a reorg, a busy quarter, or a change in team makeup. Knowing what your team values lets you keep doing it on purpose.
- Borrow from them. A strength often points to why something is working, and that lesson can transfer. If Recognition is strong because you run a weekly shout-out ritual, the same habit might lift a weaker driver like Feedback.
You don't need an action plan for a strength. Naming it in a team meeting ("we score really well on trust, and I want to keep it that way") is often enough to reinforce it.
Turning a focus area into an action
Focus areas are where the panel earns its keep. Each one is a driver your team has rated low enough to cross the weakness threshold, so it's a data-backed candidate for your attention. The goal is to move from "this is low" to "here's what I'm doing about it." A practical loop:
- 1Read the driver, then the detail. Start with the lowest driver in the panel. Then open its detail to see the individual questions and the comments behind the score. The driver name tells you what; the questions and open-text feedback tell you why. See Drivers and factors explained for how to drill into a driver.
- 2Pick one thing to change. Resist tackling all five focus areas at once. Choose the single driver where a change from you would matter most, and where you actually have influence.
- 3Create an owned action. Turn that into a concrete action plan with an owner and a due date. Vague intentions don't move scores; specific commitments do. See Build a manager action plan.
- 4Close the loop with your team. Tell people what you heard and what you're going to do. Visibly acting on feedback is itself one of the strongest ways to lift a low driver.
- 5Re-measure. After your next survey or pulse, come back to the panel. If the driver has climbed above the weakness threshold, it drops off the list, which is exactly the outcome you want.
The lowest driver in Focus areas is, by definition, where your team feels most strongly that something is missing. It's usually the highest-leverage place to begin, even if it feels like the hardest.
Why a panel might be empty
Sometimes one or both panels show "Insufficient data yet" instead of a list. This is expected behavior, not a bug. There are two common reasons.
Anonymity protection. Like everything on your dashboard, these panels respect CultureMonkey's anonymity threshold. If too few people on your team have responded, CultureMonkey hides the panels entirely so that no individual's answers can be inferred from a small sample. As more of your team responds and you clear the threshold, the panels populate automatically.
No qualifying drivers. A panel can also be empty if no driver reaches its threshold. If none of your drivers score at or above the strength line, My strengths stays empty even though you have plenty of data. The same is true in reverse for Focus areas: if every driver is comfortably above the weakness line, you have no focus areas, which is good news.
An empty panel due to anonymity means not enough responses yet, not a bad result. Don't read it as a poor score. Encourage participation, and once your team crosses the threshold the real picture appears. For the mechanics of thresholds, see Manager dashboard overview.
How these panels relate to the full heatmap
The strengths and focus areas panels are a summary. They surface the five most extreme drivers in each direction so you can act quickly. They are not a replacement for the full driver heatmap and reports, which show every driver, let you compare against benchmarks, and let you slice by demographic.
Think of it as a hierarchy:
| View | Best for |
|---|---|
| My strengths / Focus areas | A fast, ranked shortlist of what to celebrate and what to fix |
| Driver detail | Understanding why one driver scores the way it does, question by question |
| Full reports and heatmap | Comparing every driver, benchmarking, and filtering by segment |
Use the panels to decide where to look, then go deeper in the driver detail and reports to decide what to do.
Best practices
- Treat the top focus area as your default next action. If you do nothing else with this panel, create one action plan for the lowest driver each cycle.
- Don't spread yourself across all five. Five focus areas is a menu, not a to-do list. Concentrated effort on one driver beats token effort on five.
- Revisit after every survey. The panels recalculate as new responses arrive, so what you see is always current. Make checking them a habit at the start of each cycle.
- Pair the number with the comments. A driver score tells you the temperature; the open-text feedback behind it tells you the story. Always read both before you act.
- Celebrate strengths out loud. Recognizing what's working is not a soft option; it reinforces the behaviors that produced the strength in the first place.
Frequently asked questions
Why does a driver show in neither panel?
Because it fell in the gap between the two thresholds. On the default 0-10 scale, a driver scoring above 7.0 but below 8.0 is neither low enough to be a focus area nor high enough to be a strength, so it appears in neither list. It's still visible in your full CultureMonkey driver reports.
Can the same driver appear as both a strength and a focus area?
No. Both panels are built from the same set of averaged driver scores, ranked in opposite directions, so a single driver can only ever land in one panel (or neither).
Why do I see fewer than five drivers?
Each panel shows only drivers that clear the relevant threshold, up to a maximum of five. If just three of your drivers score at or above the strength threshold, My strengths shows three. It reflects your real data rather than padding the list.
The scores look different from a colleague's dashboard. Why?
Each manager's panels are calculated from their own team's responses across the surveys that feed their dashboard. Different teams, different respondents, and different survey coverage produce different strengths and focus areas.
My panel says "Insufficient data yet." What should I do?
That message means your team hasn't yet crossed the anonymity threshold, so results are hidden to protect individual responses. Encourage your team to complete the survey; once enough people respond, CultureMonkey populates the panels on its own.
Do these panels use every survey?
They average across every rating question in the surveys that feed your manager dashboard. Pulse or dashboard-only surveys that are configured to be excluded won't be counted, so the panels reflect your standing engagement surveys.
Where to go next
- The manager's process, start to finish: A manager's guide to acting on your CultureMonkey survey results
- See the whole dashboard: Manager dashboard overview
- Understand what a driver is: Drivers and factors explained
- Act on a focus area: Build a manager action plan
Your feedback helps us improve the Help Center.