

Understand drivers and factors
What an engagement driver is, how individual questions roll up into a single driver score, the 15 default drivers CultureMonkey ships with, and what "factors" really mean when you read your reports.
On this page
Open any CultureMonkey report and the first thing you'll notice is that your results aren't presented as a long list of individual questions. They're organized into a handful of named themes: Recognition, Leadership, Work Life Balance, and so on. Each theme carries a single score. Those themes are drivers, and they are the backbone of how CultureMonkey turns raw survey answers into a report you can read, compare, and act on.
This guide is the reporting-side companion to Choose the right drivers for your survey. Where that article covers picking drivers when you build a survey, this one explains what a driver actually is as a reporting concept: how a group of questions rolls up into one score, what the default driver set looks like, and what people mean when they say "factors" (and whether that's a real thing in CultureMonkey). If you understand this one idea well, almost every report in Analyse becomes easier to read.
A driver is a named theme of the employee experience that a group of rating questions measures together. Every rating answer is tagged with the driver its question belongs to, and CultureMonkey averages those answers into a single driver score per theme. Your account ships with 15 research-backed default drivers. There is no separate "factor" object in CultureMonkey - "factor" is just an informal word people use for a cluster of related drivers when they present results. The unit you actually score, filter, trend, and act on is the driver.
What a driver is
Employee engagement isn't a single feeling. It's the sum of many experiences: the work itself, the people who manage you, whether your effort is recognized, whether you can grow, whether you feel you belong. No single question can capture all of that, so CultureMonkey asks several questions and then groups the related ones together.
A driver is that grouping. It's a named theme, and behind it sits a set of rating questions that all measure the same underlying thing. Instead of reading twenty questions one at a time and trying to hold the pattern in your head, you read a handful of drivers, each summarizing every question beneath it into one number.
Think of it as two levels. At the bottom are the questions people actually answered ("My manager gives me useful feedback," "I have the freedom to decide how I do my work"). Above them sit the drivers those questions belong to (Management, Autonomy). The report speaks in drivers so that you can reason about themes, not sift through raw items.
Why this matters for reading a report: the overall engagement score tells you how engaged your people are overall, but it can't tell you what to do. Drivers can. You can't "fix engagement" as an abstraction, but you can improve Recognition if that specific driver is scoring low. Drivers are the level where a number becomes a decision. They're what you filter by, benchmark, track over time, and attach action plans to.
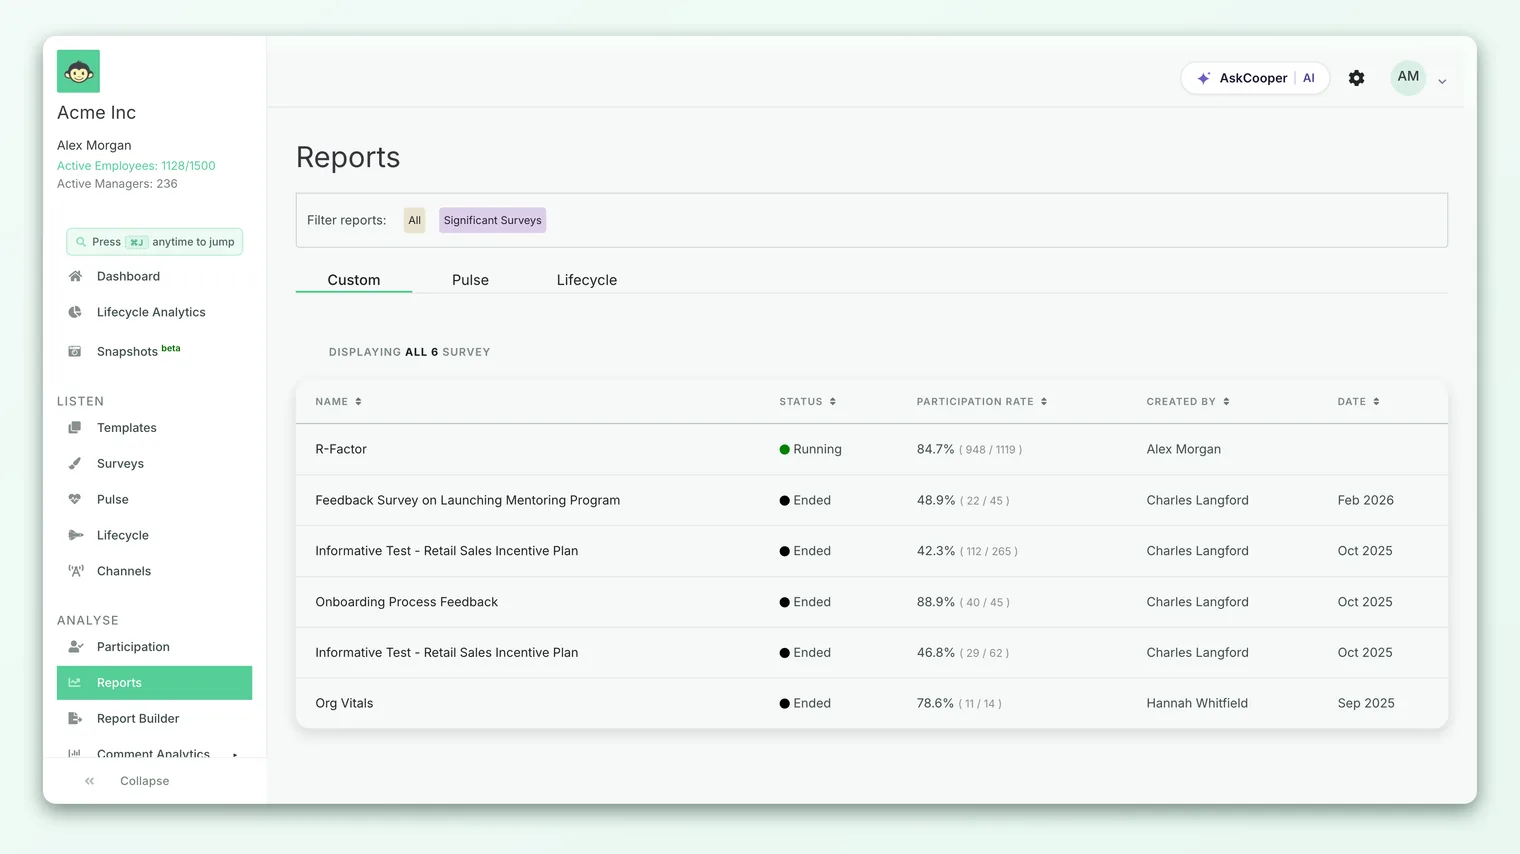
How questions roll up into a driver score
Here's the mechanism that makes a driver score possible. Every rating question in a survey is mapped to exactly one driver. That mapping is set when the survey is built (see Choose the right drivers for your survey for how questions get their driver), and it's what lets an individual answer know which theme it contributes to.
When responses come in, each rating answer is tagged with its question's driver. To produce a driver's score, CultureMonkey takes every answer that belongs to that driver, across every question mapped to it, and averages them together. That average is the driver score.
A few consequences follow from "it's an average," and they're worth internalizing because they shape how you read every report:
- A driver score is not tied to one question. If Management has four questions beneath it, the Management score blends all four. A single harsh question won't sink the driver on its own, and a single flattering one won't rescue it.
- More questions make a driver more stable. A driver backed by one question moves sharply with small shifts in sentiment. A driver backed by three or four is steadier and more trustworthy. This is why well-designed surveys give the drivers that matter a few questions each.
- Only rating questions count. Free-text and multiple-choice answers don't feed a driver score. The number is built purely from rating scales. Comments feed the qualitative side of your reports (sentiment and topics), which you read alongside driver scores rather than inside them.
A worked example
Suppose your survey has three rating questions mapped to the Recognition driver, and 100 people answered each. On CultureMonkey's default 0-10 scale, the average answers come out as:
- "I feel recognized for my work" → average 6.4
- "Good work gets acknowledged on my team" → average 7.0
- "Recognition here feels fair" → average 5.8
The Recognition driver score is the average across all those answers, which lands around 6.4. That single number is what appears on your report card, in the heatmap, and in the trend line. When you later drill into Recognition, you'll see it break back apart into those three questions, so you can tell which part of recognition is pulling the theme down. That drill path is covered in Drill down into a driver.
By default, driver scores are shown on a 0-10 scale. Depending on your account's settings, the same scores can instead be displayed out of 5 or as a percentage. The underlying math is identical - it's the same average, just presented on a different scale - so a "7.0" and a "70%" can be the very same result. If your numbers look unfamiliar, check which scale your account uses before comparing them to anything.
The 15 default drivers
Every CultureMonkey account ships with a standard set of 15 default engagement drivers, drawn from workplace-engagement research and refined across thousands of surveys. Because they're standard, your scores stay comparable from cycle to cycle and line up with industry benchmarks. When you read a report built on the default set, these are the themes you'll be looking at:
| Driver | What it measures |
|---|---|
| Autonomy | The freedom employees have to do their work without micro-management (a focus on what gets done over how). |
| Work Environment | Whether the physical environment people work in supports them and adds positivity to their day. |
| Leadership | The trust and confidence employees have in company leadership, and whether leaders show genuineness. |
| Management | How employees experience their direct supervisors, processes and policies (the employee-manager relationship). |
| Work Life Balance | The balance between time spent on work and time for personal interests, family, and life outside the job. |
| Involvement | How involved employees feel in decisions that affect their work, and whether their ideas are heard. |
| Communication | How effectively the organization communicates, and whether people feel connected to its vision and updates. |
| Rewards | Whether employees feel fairly compensated, and how well the incentive and reward structure works. |
| Recognition | Whether people are recognized for their work and effort (a strong lever on loyalty and retention). |
| Growth & Development | Whether the organization offers real opportunities for personal and career development. |
| Purpose Alignment | How aligned employees feel to the vision, mission and goals of the organization. |
| Innovation | How innovative the organization is in employees' eyes, often an early signal of where the business lags. |
| Wellness | The physical and mental wellbeing of employees. |
| Meaningful Work | Whether people feel their role contributes to something bigger than the task in front of them. |
| Social Connection | The quality of peer relationships, a growing part of belonging and retention. |
Not every survey uses all 15. A focused engagement survey might use eight to ten of these; a short pulse might use just two or three. So when you read a report, the drivers you see reflect the drivers that survey was built to measure, not the full catalog. If a theme you expected is missing, it likely wasn't part of that survey.
Alongside the 15 defaults, an organization can define its own custom drivers for themes the standard set doesn't capture (a company-specific value, a bespoke competency framework, a named program). A survey uses either the default set or the custom set, never a mix. If your report shows themes that aren't in the table above, you're reading a custom-driver survey. The trade-off is that custom drivers don't carry industry benchmarks. See Choose the right drivers for your survey for the full picture.
So what about "factors"?
You'll hear the word "factor" used around engagement reporting, and it's worth being precise about what it means in CultureMonkey, because it's a common source of confusion.
Some organizations like to think about engagement at a level above drivers, grouping several related drivers into a broad factor. For example, they might present Leadership, Management and Communication together as one "Leadership & Direction" family, or bundle Wellness, Work Life Balance and Social Connection into a "Wellbeing" story. This is a genuinely useful mental model when you're briefing executives who want the ten-thousand-foot view and don't need all fifteen themes at once.
But here's the important part: in CultureMonkey, a "factor" is a way of talking, not a thing you configure. There is no separate factor object in the product. Questions map to drivers; drivers are what get scored, filtered, trended, benchmarked, and acted on. There is no layer where you define factors, assign drivers to them, or read a "factor score" the way you read a driver score.
If someone asks you to "pull the factor scores," what they almost certainly want is a grouped view of related driver scores that you assemble yourself (for a slide or a summary), not a built-in report screen. The taxonomy CultureMonkey actually stores and scores is question → driver. Treat factors as a way to cluster and narrate drivers, and drivers as the real unit you work with.
So when you read your reports, work at the driver level. If you want to present a higher-level story, group the relevant drivers yourself and speak about them as a theme. That gives you the executive summary without pretending there's a data structure underneath it that CultureMonkey doesn't have.
Where drivers show up in your reports
Once you understand a driver as "a theme with an averaged score," almost everything in Analyse clicks into place, because it's nearly all organized by driver:
- 1Driver scores and heatmaps - every theme's score at a glance, so you immediately see strengths (high scores) and focus areas (low ones). This is usually the first thing you read on a report.
- 2Drill-downs - open a single driver to see the questions beneath it and how each contributed, and to compare the driver across teams, locations, or managers. See Drill down into a driver.
- 3Trends over time - watch a driver's score move across survey cycles, which is how you prove whether your actions are working. See Track driver trends over time.
- 4Benchmarks - compare your default-driver scores against your industry. Custom drivers don't have external benchmarks.
- 5Action plans - attach directly to a driver, closing the loop from "this theme scored low" to "here's what we're doing about it."
The through-line is that the driver is the atom of the whole reporting system. Learn to read one driver well and you can read the entire report.
Drivers vs the overall engagement score
It's easy to mix these up, so it helps to hold them side by side:
| Driver score | Overall engagement score | |
|---|---|---|
| What it answers | How are we doing on this specific theme? | How engaged are we overall, across everything? |
| Based on | The rating questions mapped to that one driver | Ratings across many drivers, combined |
| Best for | Diagnosis: where to focus and act | A single headline pulse of engagement |
| Granularity | One theme at a time | The whole picture in one number |
They work together. The overall engagement score is the headline; the driver scores are the diagnosis behind it. When your overall score dips, you look at the drivers to find out which themes dragged it down. For how the headline number itself is built, see Understand the overall engagement score.
Frequently asked questions
Is a driver score a percentage?
Not necessarily. By default, driver scores are shown on a 0-10 scale. Depending on your account's settings, the same score can be displayed out of 5 or as a percentage instead. It's the same underlying average either way, just presented on a different scale. Check which scale your account uses before comparing scores across reports or against benchmarks.
Does every question count toward a driver score?
Only rating questions do. A driver score is the average of the rating answers mapped to that driver. Free-text and multiple-choice answers don't move the number; they feed the qualitative side of your reports (comments, sentiment, and topics), which you read alongside driver scores.
Can I create a "factor" that groups several drivers?
There's no factor object to create in CultureMonkey. The product stores and scores at the driver level. If you want to present several drivers together as one theme for a leadership summary, group them yourself in your slide or report narrative. The scores you'd combine are still the individual driver scores.
Why does a driver I expected not appear in my report?
Because a survey only carries the drivers it was built to measure. Not every survey uses all 15 defaults, so if a theme is missing, it most likely wasn't part of that survey's design. A report built on custom drivers will show a different set of themes entirely.
Why is one driver's score less reliable than another's?
Because a driver score is an average, a driver backed by a single question swings more with small shifts in sentiment than one backed by three or four. When a driver matters to you, giving it a few questions makes its score steadier and more trustworthy.
How do I see what's behind a driver score?
Open the driver to drill in. You'll see the individual questions that make it up and how each one scored, plus the ability to compare the driver across teams, locations, and managers. See Drill down into a driver.
Where to go next
- Pick drivers when you build: Choose the right drivers for your survey
- Go one level deeper: Drill down into a driver
- Watch a theme over time: Track driver trends over time
- See the headline number: Understand the overall engagement score
Your feedback helps us improve the Help Center.