

Track participation in real time
How to watch a live survey fill up in CultureMonkey - where the Participation view lives, what sent, received, and rate really mean, how to slice by team or demographic, and why the anonymity threshold sometimes hides a number.
On this page
- What "participation" actually measures
- Where to watch it live
- Reading the four numbers on the Participation view
- Slicing by team, location, or manager
- Exporting the detail
- How the anonymity threshold affects what you can see
- Putting it into practice: a launch-week routine
- Best practices for tracking participation
- Frequently asked questions
- Where to go next
Once a survey goes out, the first question on every admin's mind is the same: are people actually responding? Watching participation while a survey is live tells you whether your launch landed, which teams are engaged, and where a well-timed nudge will do the most good. Waiting until the survey closes to find out is too late to fix a thin response rate.
This guide shows you exactly where to watch participation in CultureMonkey, what each number means (and how it's calculated), how to slice the picture by team, location, or manager, and why a segment sometimes shows no number at all. The goal is simple: by the end, you'll be able to open a running survey, read its health at a glance, and know what to do next.
CultureMonkey tracks participation live from your survey's report and from the standalone Participation view under Analyse. The headline is your participation rate (responses received divided by people invited). You can break it down by team, location, or manager to find where responses are lagging, then follow up. Small segments stay hidden until they cross the anonymity threshold, so no individual can be identified.
What "participation" actually measures
Participation is the share of invited people who have submitted a response. In CultureMonkey it comes down to two counts and the ratio between them:
- Participants (invited) - everyone in the survey's audience. Each person added to the survey becomes a participant record, whether or not they've answered yet.
- Submissions (received) - the number of people who have completed and submitted the survey.
The participation rate is just:
> Participation rate = Submissions ÷ Participants × 100
So if 500 people were invited and 300 have submitted, your rate is 60%. This is the same formula everywhere the number appears, which is why the dashboard, the report, and the standalone Participation view all agree. It's counted per person, not per answer: submitting once counts once, no matter how many questions the survey has.
A 40% rate on a 2,000-person census (800 responses) is a bigger, more reliable sample than 90% on a 20-person team (18 responses). Always read the rate and the raw counts together, especially before you draw conclusions from a segment.
Where to watch it live
Participation shows up in three places, from the quickest glance to the deepest breakdown.
1. The Dashboard
Your home Dashboard shows participation rate for recent surveys alongside your overall engagement score and eNPS. It's the fastest way to see, at a glance, whether a launch is tracking well without opening anything.
2. The survey's report summary
Open the survey from Listen > Surveys (or from Analyse > Reports) and the summary is your live control panel while the survey runs. Near the top you'll see the participation rate with a progress bar, and a Key stats panel that lists, in plain language:
- how many invitation emails were sent,
- how many people responded,
- how many haven't responded yet,
- and, once there's click data, the bounce rate (people who opened the survey but didn't finish) and the average response time.
That same panel also lists your scheduled reminders and marks which have already gone out, so you can see at a glance whether the next nudge is queued or already delivered. For the mechanics of setting those up, see Follow up with non-responders.
3. The Participation view under Analyse
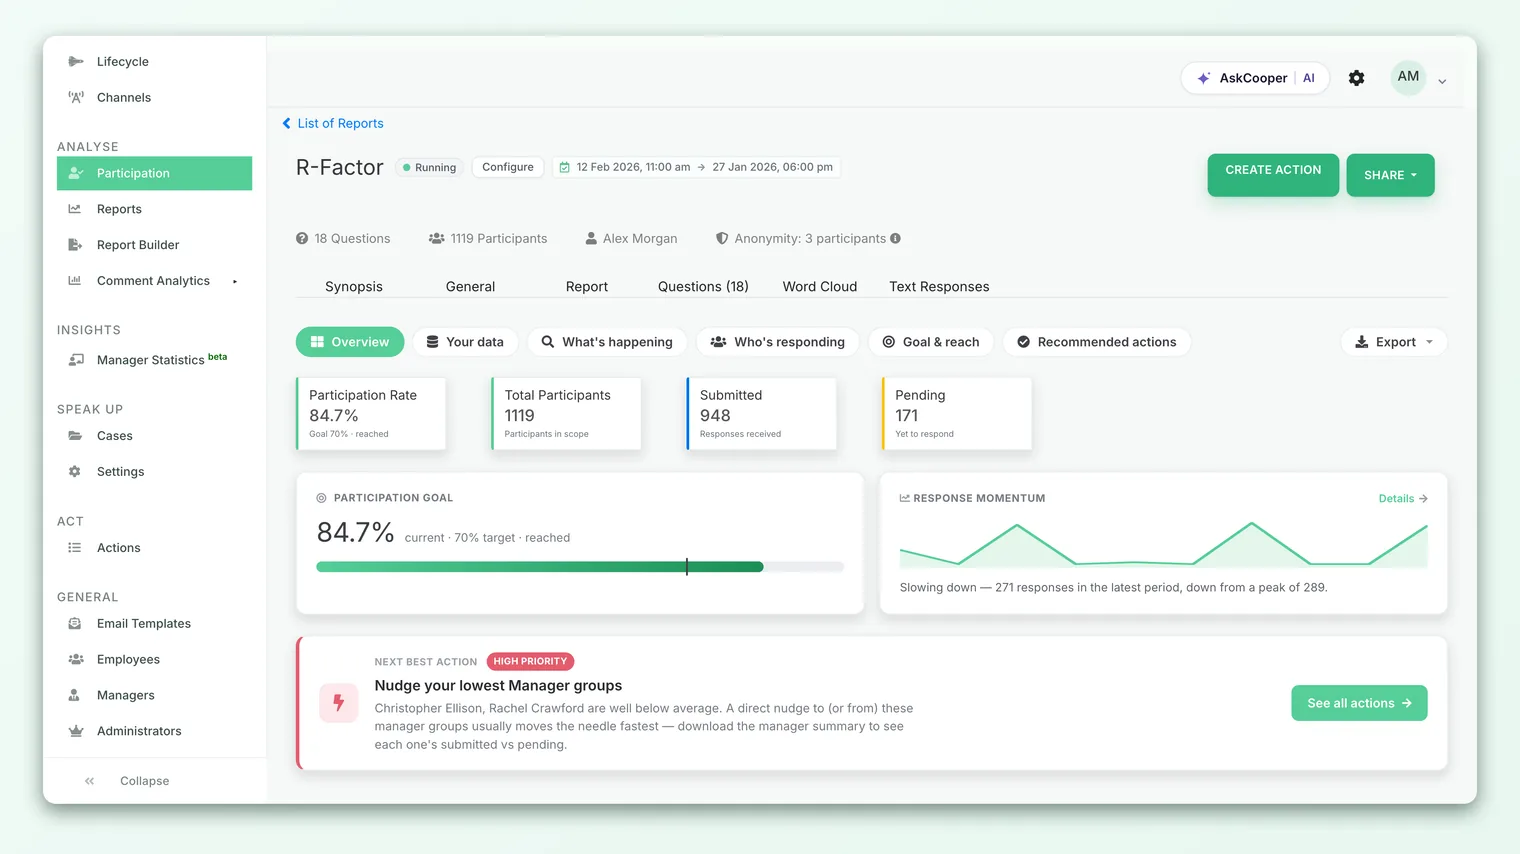
For a dedicated, sliceable picture, open Analyse > Participation. This is a standalone page built for exactly one job: tracking how a survey is collecting responses. You pick a survey from the Choose survey dropdown at the top (running and recently ended surveys are listed), and the page loads its live participation picture underneath.
The dedicated Participation view is rolling out and may not be switched on for every account yet. If you don't see it under Analyse, the report summary described above gives you the same core numbers (rate, sent, received, pending) for any survey.
Reading the four numbers on the Participation view
The Participation view leads with four summary cards. Here's what each one means and how they relate:
| Card | What it shows | How it's derived |
|---|---|---|
| Participation Rate | Overall completion percentage | Submitted ÷ Total participants × 100 |
| Total Participants | Everyone invited (in scope) | Count of participant records for the survey |
| Submitted | Responses received so far | People who have completed the survey |
| Pending | Yet to respond | Total participants − Submitted |
The four are internally consistent: Submitted + Pending = Total Participants, and Rate = Submitted ÷ Total. If you apply a filter (say, one location), all four cards recompute for just that group, so the rate you see always matches the counts beside it.
There's no universal target, but a useful rule of thumb: engagement and lifecycle surveys often land in the 60-80% range for a healthy launch, while lighter pulse surveys run lower because they go out more often. What matters most is the trend across your own cycles and whether specific teams are dragging the average down. A single number in isolation rarely tells the whole story.
Slicing by team, location, or manager
The average rate hides as much as it reveals. A comfortable company-wide 70% can easily contain a team sitting at 20%, and that team is exactly where a nudge pays off. This is why breaking participation down by segment is the core of tracking it well.
On the Participation view you can group the breakdown by a demographic - manager is the default, and you can switch to team, location, and other attributes your account records. Each row shows that group's participant count, submissions, and rate, so you can sort mentally from weakest to strongest and see where responses are stalling.
The report summary offers the same idea in a more action-oriented form. On a running survey, the Boost Participation Rate link opens a table of reporting managers with each manager's participation rate, total participants, and total answered. You can filter to managers below a rate band, select the laggards, and send them a reminder in a couple of clicks.
- 1Open the running survey - go to Listen > Surveys (or Analyse > Reports) and open it while it's live.
- 2Scan the headline - check the overall participation rate and the sent / received / pending counts.
- 3Break it down - use the Participation view's group-by (or the Boost Participation manager table) to find the lowest-responding teams or managers.
- 4Nudge the laggards - trigger a reminder to the groups that are behind. See Follow up with non-responders.
- 5Watch it move - refresh over the next day or two to confirm the reminder lifted the rate where you targeted it.
Exporting the detail
When you need the full list rather than the on-screen top groups, the Participation view offers downloads:
- Breakdown export - every group in your chosen cut (team, location, manager, and so on) with counts and rates, not just the top rows shown on screen.
- Full report - a multi-sheet workbook that breaks participation across several demographics at once, useful for a leadership readout.
- Participation over time - a day-by-day timeline of how responses accumulated, so you can see the spike after launch and after each reminder.
These exports are handy for sharing progress with people who don't log in, or for keeping a record of how a campaign built momentum over its run.
A "pending" or non-responder export by its nature lists named individuals who haven't answered yet. That's fine for chasing responses, but treat the file with care: don't circulate it widely, and remember it's an operational list, not survey results. It never reveals what anyone answered, only whether they've responded.
How the anonymity threshold affects what you can see
CultureMonkey protects respondents by hiding results for groups that are too small to be safely anonymous. This applies to participation breakdowns too, and it's the most common reason a segment looks empty when you know people are in it.
Every survey has a minimum response threshold. For anonymous surveys this can't drop below a floor of 3 responses. If a segment you're slicing by (a five-person team, or a very narrow filter combination) hasn't reached that threshold yet, its breakdown row is suppressed so that no single person's participation, and later no single person's answers, can be inferred from the numbers.
A few things worth knowing:
- The overall rate is safe. The company-wide participation number virtually always clears the threshold, so the headline card is nearly always visible even early in a survey.
- It's the small slices that hide. The more granular your filter, the more likely you'll hit a group below the threshold. This is expected behavior, not a bug.
- Non-anonymous surveys have a lower floor. If a survey is explicitly non-anonymous, the threshold drops to your account's non-anonymous minimum (often 1), so smaller groups can show. Anonymous surveys keep the protective floor of 3.
If a breakdown row is blank or a filtered view shows nothing, that's almost always the threshold at work. The full walkthrough of why this happens and what to do lives in Why can't I see results yet?.
It's tempting to see the hidden row as an obstacle. It's actually the thing that makes honest participation possible: people respond freely precisely because they know a small team's data can't be singled out. Waiting for the threshold is the price of candid feedback, and it's worth paying.
Putting it into practice: a launch-week routine
Here's a simple rhythm for the days after a survey goes out:
- Day 1 (launch): confirm the survey actually sent - check the "emails sent" count matches your audience size. A zero here means a delivery problem, not a participation one.
- Day 2-3: watch the overall rate climb. Most of your early responses arrive in the first 48 hours. Break down by team to spot any group that's flat.
- Mid-run: send a first reminder to non-responders, then check the timeline export a day later to confirm the bump.
- Before close: do a final manager-level pass with Boost Participation, targeting the lowest bands, and give people a last window to respond.
- After close: the same participation data becomes your denominator for reading results - a low rate in a segment is important context when you interpret that segment's scores.
Best practices for tracking participation
- Lead with the trend, not the moment. A rate climbing steadily is healthier than a high number that's stalled. Refresh over time rather than judging on one look.
- Always pair rate with count. A 100% rate on a tiny team is a smaller signal than a 55% rate on a large one.
- Target nudges, don't blanket them. Reminding people who've already responded erodes goodwill. Use the breakdown to reach only the groups that are behind.
- Don't chase the number by breaking anonymity. Never pressure a small team to respond in a way that lets you guess who said what. That destroys the trust the survey depends on.
- Keep launch timing in mind. Rates dip around holidays, quarter-end, and big org events. A "low" week may be timing, not disengagement.
Frequently asked questions
How often does the participation number update?
It reflects the responses received up to when you load the page, so refreshing gives you the current picture. There's no long delay between someone submitting and their response counting toward the rate.
Does clicking or opening the survey count as participation?
No. Only a completed submission counts toward the participation rate. CultureMonkey tracks opens and clicks separately and shows them as the bounce rate (people who viewed the survey but didn't finish), which is a useful early warning that your invitation is landing but the survey isn't getting completed.
Why does a team show no participation rate?
Almost always because that group hasn't crossed the anonymity threshold yet (a minimum of 3 responses for anonymous surveys). The row stays hidden until enough people respond. See Why can't I see results yet?.
Can managers see their own team's participation?
Yes. Managers and sub-admins see participation scoped to the teams and people they're mapped to, subject to the same anonymity threshold. They can use it to chase their own non-responders without seeing the rest of the organization.
Is the participation rate the same as the response rate?
Yes, they're two names for the same thing in CultureMonkey: responses received divided by people invited. Some organizations say "response rate" for the same number.
Will low participation hide my results too?
It can, at the segment level. If a team never reaches the threshold, that team's scores stay hidden along with its participation, which is exactly why watching participation live and nudging early matters so much.
Where to go next
- Chase the people who haven't answered: Follow up with non-responders
- A segment showing nothing? Why can't I see results yet?
- Turn responses into meaning: Understand the overall engagement score
Your feedback helps us improve the Help Center.