

Drill down into driver performance
How to open a single engagement driver in CultureMonkey and see the whole story behind its score - the questions that make it up, how it breaks down by team, location, or any attribute, and how to find the group or question that is dragging it down.
On this page
- What "drilling down" actually means
- Where driver scores live
- Open the drill-down for a driver
- Break the driver down by another attribute
- Read the questions behind the driver
- A worked example: finding what drags a driver down
- Filters carry into the drill-down
- Why some groups and questions are hidden
- Best practices
- Frequently asked questions
- Where to go next
A driver score tells you how your people feel about one dimension of work - recognition, manager relationship, growth, and so on. But a single number like "Recognition: 6.4" only raises the next question: for whom, and driven by which question? A 6.4 that is uniformly middling across the company is a very different problem from a 6.4 that is 8.2 in most teams and 3.1 in one.
Drilling down into a driver is how you turn that one number into a diagnosis. It lets you open a single driver, see the questions that make it up, and break its score down by team, location, manager, or any attribute you track - so you can find the exact group or question that is pulling the driver down and act on the real cause instead of the average.
Click any driver cell in the report heatmap to open the Heatmap Drill Down view for that driver. It shows the driver's score for the group you clicked, a gauge, a Demographics breakdown you can re-slice by any other attribute, and a Questions table listing every question in the driver with its own score. Use it to trace a soft driver down to the specific group or question behind it. CultureMonkey hides groups too small to stay anonymous.
What "drilling down" actually means
Every driver score in CultureMonkey is an average of question answers. When employees answer the rating questions in a survey, each question is tagged to a driver. The driver's score is simply the average value of all the answers to all the questions mapped to that driver, for whichever population you are looking at.
That structure gives you two natural directions to drill in:
- By question. A driver usually contains several questions. One weak question can drag the whole driver down while the others look fine. Breaking a driver into its questions shows you which part of the theme is the problem.
- By group. The same driver can be strong in one team and weak in another. Breaking a driver down by team, location, manager, or a custom attribute shows you where the problem lives.
Drilling down combines both. You start from one driver-and-group score and expand it in either direction (or both) until you reach something specific enough to act on. To understand what drivers are and how questions map to them in the first place, see Drivers and factors explained.
Where driver scores live
Driver scores appear in a survey report and on your dashboard, most visibly as a heatmap: drivers down one axis, demographic groups across the other, and a colored score in every cell.
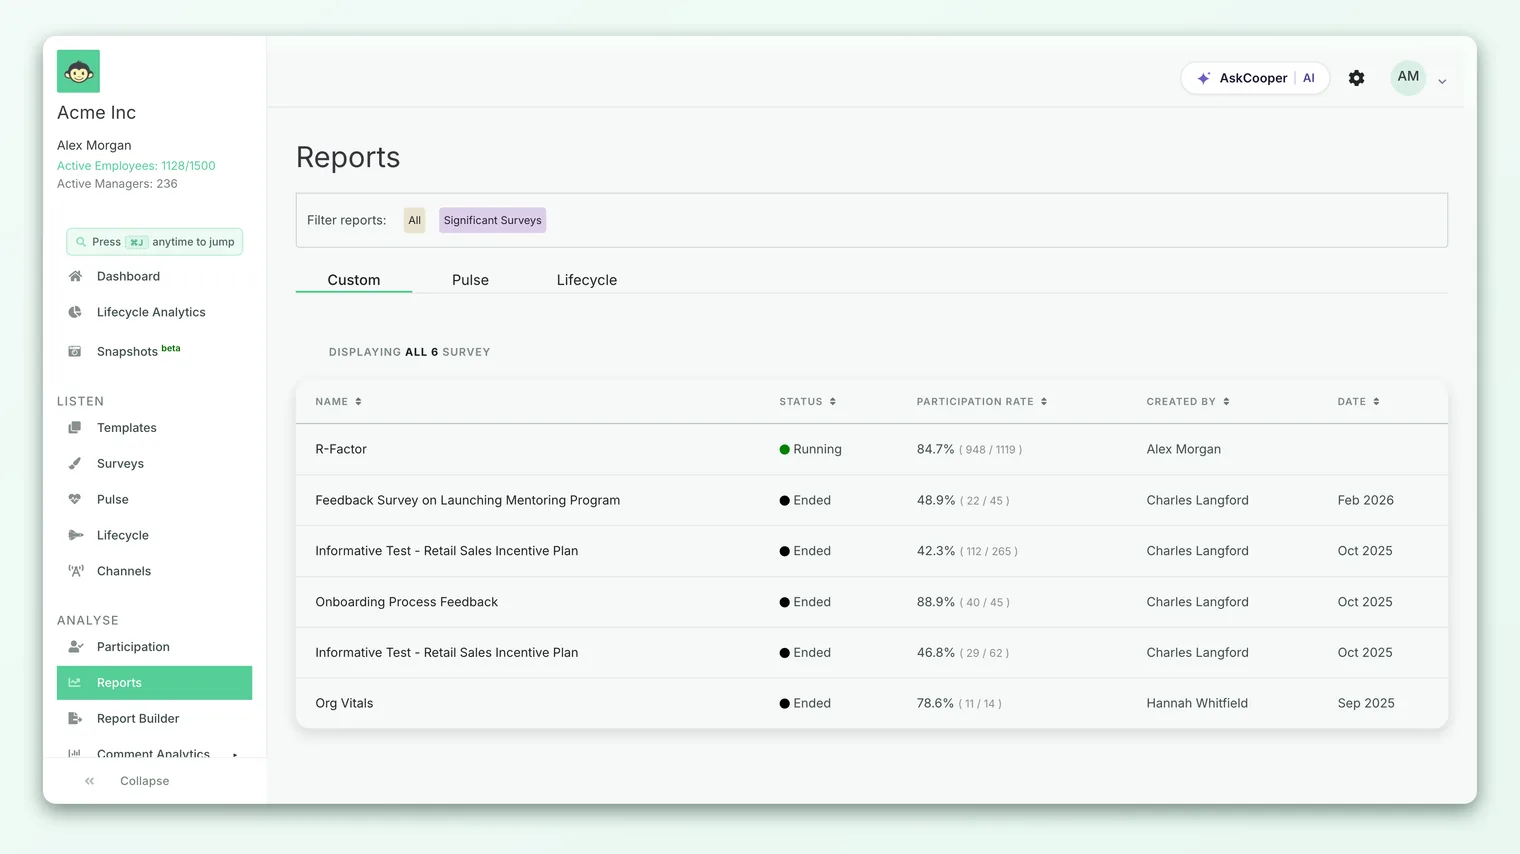
Each cell is the score for one driver and one group - for example, "Recognition, for the Sales team." That cell is where a drill-down begins. If you are new to reading the grid itself (rows, columns, and the color bands), start with Read a heatmap of driver scores, then come back here to go deeper into a single cell.
Open the drill-down for a driver
To investigate a driver, click its cell in the heatmap. CultureMonkey opens the Heatmap Drill Down view for that specific driver-and-group combination.
- 1Find the cell - in the report heatmap, locate the driver you want on one axis and the group you want on the other. If you just want the driver overall, use its all-employees (or "All") column.
- 2Click the cell - this opens the Heatmap Drill Down view. A short loading state appears while the scores are fetched.
- 3Read the header - the view labels exactly what you are looking at with two badges: a Driver badge (for example, Recognition) and a demographic badge (for example, Team: Sales), followed by a one-line summary such as "Recognition driver score for Sales team is 6.4."
- 4Check the gauge - a gauge chart shows the same score visually, so you can see at a glance where it sits on the scale.
From here the view has two working sections: a Demographics breakdown and a Questions table. Together they answer "where is this driver weak?" and "which question is weak?"
The fastest way to use drill-down is to start from a cell that already looks bad. The heatmap colors the lowest scores so they stand out; open one of those, and the breakdown below usually points straight at the group or question responsible.
Break the driver down by another attribute
The Demographics section is the heart of the drill-down. You have opened a driver for one group; now you can re-break that same driver score across a different attribute to see how it varies.
A dropdown labeled with the available attributes lets you choose what to break the score down by. The options are the demographic types your account tracks: standard ones like team, location, manager, sub team, and business unit, plus built-in splits like gender, employee type, and tenure, and any custom attributes you have configured. The attribute you already filtered by is removed from the list, since re-splitting by the same thing would tell you nothing new.
Pick an attribute, and CultureMonkey shows the driver's score for each value of that attribute - each team, each location, each tenure band - as a small breakdown graph. This is where hidden variation surfaces:
- A Growth driver at 6.0 company-wide might be 7.8 for people with more than five years of tenure and 4.1 for people in their first year.
- A Manager relationship driver that looks fine overall might collapse in one or two locations.
Because you can keep changing the attribute in the dropdown, you can test several theories in seconds - "is this a team problem? a tenure problem? a location problem?" - until the pattern becomes obvious. This is the same idea as grouping a single question's score by demographic, applied to a whole driver at once.
You can drill into the special Overall Score row the same way you drill into a driver, to see the engagement score for a group. Because Overall Score is not a single driver, the demographic re-slice is not offered for it - you still get the score, the gauge, and the questions list, but not the by-attribute breakdown.
Read the questions behind the driver
Below the demographics breakdown, the Questions table lists every question that belongs to this driver, each with its own score for the group you are looking at. This is the "by question" direction of the drill-down, and it is often where the real answer is.
The table shows the question text alongside its score. Reading it top to bottom tells you whether the driver is uniformly soft or whether one question is doing the damage:
| What you see in the questions table | What it usually means |
|---|---|
| All questions cluster near the driver score | The whole theme is genuinely low; treat it as a broad issue |
| Most questions are healthy, one is far lower | That one question is dragging the driver down; focus there |
| Scores are split into two clumps | The driver may be mixing two sub-themes; read the wording carefully |
| A question shows a dash ( - ) instead of a score | Not enough responses for that question in this group to show a score |
A dash means the score is unavailable for that cell, most often because too few people answered to meet the anonymity threshold (more on that below).
To go further on any single question, use the View all questions link in this section. It takes you to the full question report, where you can see the response distribution, group the question by demographic, and read the comments attached to it. That is usually the last hop: driver → group → question → comments, ending in the actual words behind the number.
A worked example: finding what drags a driver down
Say your Recognition driver sits at 6.4 company-wide - not a crisis, but the lowest of your drivers. Here is how a drill-down turns that into something you can act on.
- 1Open the driver. Click the Recognition cell for all employees. The header confirms "Recognition driver score is 6.4," and the gauge shows it sitting in the middle band.
- 2Break it down by team. In the Demographics dropdown, choose team. Most teams land between 6.8 and 7.5 - but Support shows 4.2. The company average was hiding one struggling team.
- 3Re-slice to sanity-check. Switch the dropdown to tenure and then location. Both look even, which tells you this is a Support-team issue, not a tenure or location issue.
- 4Reopen scoped to Support. Click the Recognition cell for the Support team. Now the header reads "Recognition driver score for Support team is 4.2," and the questions table is scoped to Support.
- 5Read the questions. Two questions score around 5, but "My manager recognizes my contributions" scores 2.9. That single question is dragging the driver down for this team.
- 6Go to the words. Use View all questions to open that question's report and read the comments. Now you are not guessing - you know it is recognition from managers, in Support, and you can read exactly what people said.
In six clicks you have gone from a bland 6.4 to a specific, ownable problem: manager recognition in the Support team. That is what drill-down is for.
Filters carry into the drill-down
If you have applied filters to the report - a date range, or the heatmap's complex filters - they carry into the drill-down, so the scores you see are consistent with the report you opened. When a filter is active, the drill-down header shows a FILTERED marker so you are never misreading a filtered number as the full-population one. Clearing the filters on the report and reopening the cell returns you to the unfiltered view.
Why some groups and questions are hidden
Drill-down obeys the same anonymity threshold as the rest of CultureMonkey. When you break a driver down by an attribute, any group with fewer respondents than the threshold is left out of the breakdown, and a question with too few answers for the current group shows a dash instead of a score. This is deliberate: it stops anyone from narrowing the filters far enough to infer a single person's answers.
So if a breakdown looks shorter than you expected, or a promising cell is blank, the usual reason is simply that the group is too small to report on safely, not that something is broken. Widen the group (drill by a broader attribute, or remove a filter) and the numbers reappear once enough people are behind them. For the full explanation, see Why can't I see results yet?.
Even when a small group does clear the anonymity threshold, treat an extreme score there with care. A driver at 3.0 for a group of four people can swing wildly with one more response. Look for patterns that hold across a reasonable number of respondents before you build an action plan on them.
Best practices
- Always drill before you act. A company-level driver score is an average of averages. Never build an action plan on the headline number alone - open it and find the group or question first.
- Test more than one attribute. Before concluding "it's a team problem," re-slice by tenure and location too. If only one attribute shows the gap, you have found the real dimension.
- Follow the weakest question to its comments. The per-question scores tell you what; the comments behind the weakest question tell you why. Use View all questions to close that gap.
- Compare like with like. When you scope a driver to a group, remember its score is now that group's number, not the company's. Keep track of which population each score belongs to.
- Respect the dashes. A blank is information: it means "too small to show." Do not chase it - widen the group instead.
Frequently asked questions
Where do I click to start a drill-down?
Click a driver's cell in the report or dashboard heatmap - the intersection of a driver and a demographic group. That opens the Heatmap Drill Down view for that driver and group.
Why is the driver score different after I drill in?
Because you have scoped it. The number in the drill-down is the driver's score for the group you clicked, not for the whole company. The header always states which group the score belongs to.
Can I break one driver down by two attributes at once?
Not in a single view. You drill by one attribute at a time, but you can reopen the driver scoped to a specific group and then break that down further, which achieves the same effect step by step.
A question shows a dash instead of a score. Why?
CultureMonkey shows a dash when there were not enough responses to that question, in the group you are viewing, to meet the anonymity threshold. Broadening the group usually brings the score back.
Does the demographic breakdown appear for the Overall Score?
No. You can drill into Overall Score to see a group's engagement score, gauge, and questions, but the by-attribute breakdown is offered only for individual drivers.
Do report filters apply inside the drill-down?
Yes. Date ranges and complex heatmap filters carry through, and CultureMonkey shows a FILTERED marker so you know the scores are scoped. Clear the filters and reopen the cell to see the full-population view.
Where to go next
- Understand the building blocks: Drivers and factors explained
- Slice a single question: Group question scores by demographic
- Read the grid it all starts from: Read a heatmap of driver scores
Your feedback helps us improve the Help Center.