

View, filter and track all cases
How to use the Speak Up case list to find reports by stage, risk, category and assignee, read SLA and due-date signals, and watch case volume trends.
On this page
The Cases screen is the home base for everyone who handles Speak Up reports. It's the single list of every case you're allowed to see, with the controls you need to find the right one fast, understand how urgent it is, and keep the whole program moving. Whether you're triaging a fresh report, chasing an investigation that's running long, or reviewing how many concerns came in this quarter, this is where you start.
This guide walks through the case list end to end: how to read each column, how to filter by stage, risk level and category, how assignment works, how acknowledgment and feedback timelines are tracked, and how the built-in analytics view shows case volume and trends over time.
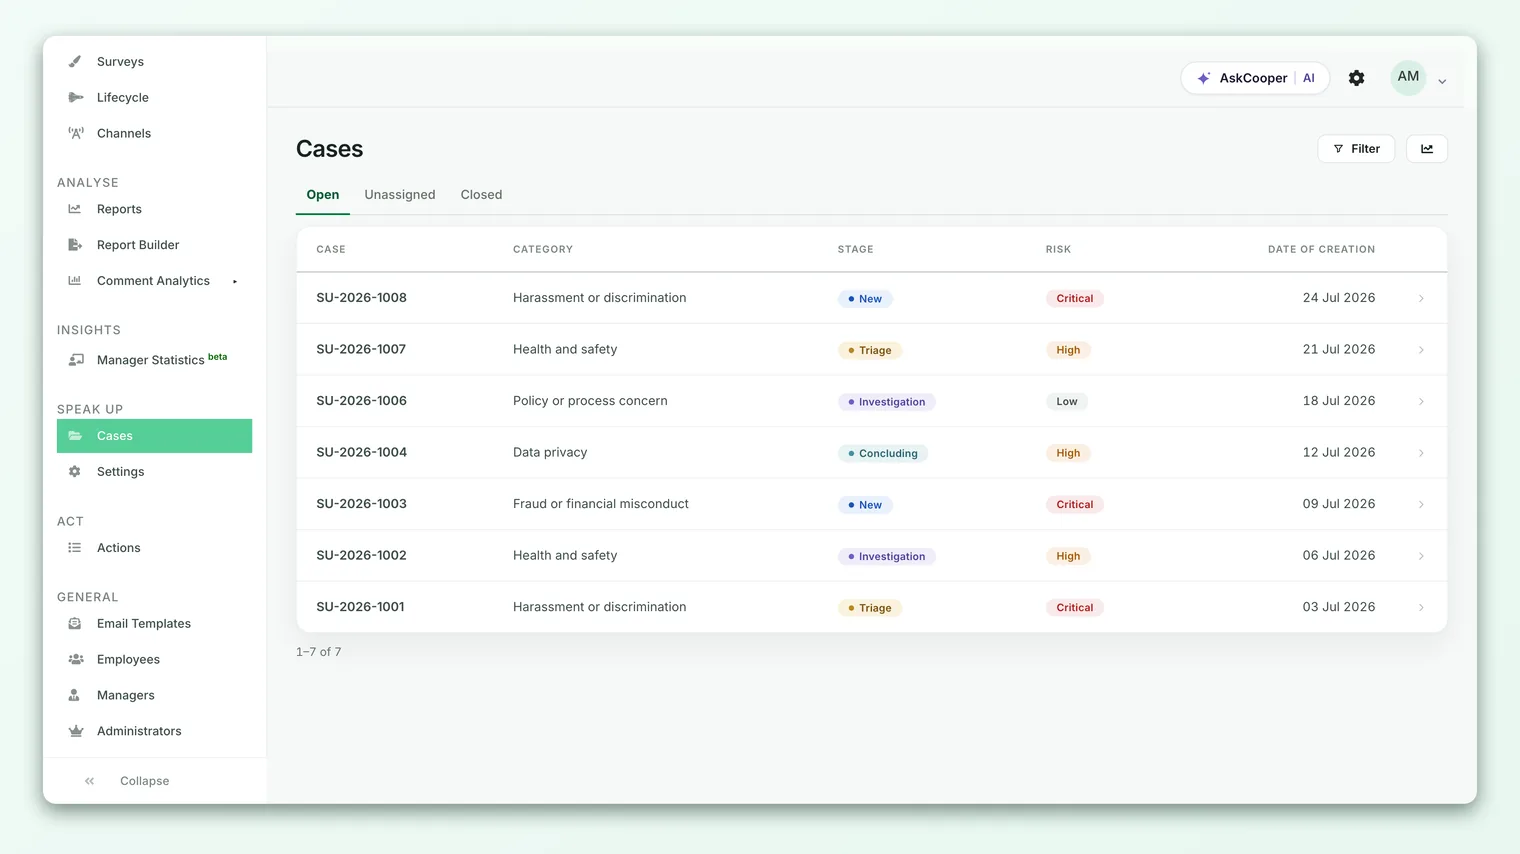
Open Speak Up → Cases in CultureMonkey to see every report you have access to, newest first. Use the Filter button to narrow by stage, category and risk level, click any row to open the full case, and open the Analytics view for total volume, a stage breakdown, and cases by category compared against the prior period.
Where to find the case list
The case list lives under Speak Up in the left navigation. Click Cases (the folder icon) and you land on the full list. If your CultureMonkey Speak Up portal hasn't been enabled yet, this screen shows a setup prompt instead of cases, and a Speak Up Admin needs to turn the portal on first. For more on the program itself, see What is Speak Up?.
What you can see depends on your access
Speak Up is deliberately restrictive about who sees what, because reports often contain sensitive, sometimes identifying, information. The case list only ever shows the cases you're entitled to see.
- Admin: sees every case across all categories. This is the broadest role.
- Members and Viewers: see only the cases in the categories they've been assigned to. If a member isn't scoped to the "Harassment" category, harassment cases simply don't appear in their list, filters, or analytics.
This scoping is applied before anything else, so filtering and sorting always operate within the set of cases you're allowed to view. It's a feature, not a gap: it keeps each case in front of the smallest necessary audience. To manage who can see which categories, see Manage Speak Up categories and risk levels.
Reading the case list
Each row is one report. The list is sorted with the most recently created case first, and every column is there to help you judge, at a glance, what needs attention.
| Column | What it tells you |
|---|---|
| Case | The unique report number (for example, SU-7F3K2A). This is how reporters and the case team refer to a case without using names. |
| Category | The topic the reporter chose (for example, "Harassment" or "Financial misconduct"). Shows Uncategorized if none was set. |
| Risk | A colored badge - Critical, High, Medium or Low - that comes from the case's category. |
| Stage | Where the case sits in its lifecycle: New, Triage, Investigation, Concluding or Closed. |
| Date of Creation | When the report was submitted, in your account's timezone. |
Click any row (or press Enter when it's focused) to open the full case, where you'll find the reporter's intake, the secure two-way message thread, attachments, the assignee, and the stage controls.
The Risk badge isn't set case by case. It's inherited from the case's category, so if you change a category's risk level, every case in that category reflects the new level. That keeps risk consistent and means you triage the type of concern the same way every time. Critical and high categories are the ones you generally want to see and act on first.
Sorting the list
The column headers - Case, Category, Risk, Stage and Date of Creation - are clickable to sort the cases currently shown on the page. This is handy for quickly grouping the visible rows by stage or ordering them by date. The list also paginates in blocks, so use the page controls at the bottom to move through larger volumes, and apply a filter first if you want to narrow before you sort.
Filtering to find the right cases
The real power of this screen is the Filter button in the top right. Click it to open a panel with three filters, each a multi-select so you can combine several values at once.
- 1Stage - narrow to one or more stages, such as showing only New and Triage to see everything waiting for a first response, or only Investigation to review active work.
- 2Category - focus on specific topics. You'll only see the categories you have access to; an Admin sees the full list.
- 3Risk level - filter to Critical, High, Medium or Low to surface the most serious concerns first.
- 4Apply filters - click to update the list. Use Clear all to reset back to every case you can see.
Filters combine with and logic across the three types and or logic within a type. So selecting stage New plus risk levels Critical and High shows new cases that are either critical or high risk - exactly the "needs attention now" shortlist most teams want to start their day with.
Filter chips
Every active filter appears as a chip just below the header (for example, Stage: Triage or Risk: Critical). Each chip has a small ✕ you can click to remove that one value without reopening the panel, so you can loosen a filter one criterion at a time. The chips also make it obvious, at a glance, that you're looking at a filtered subset rather than the whole list.
Because your selected filters are carried in the page address, you can bookmark a filtered view (say, "open critical cases") or share the link with another authorized member, and they'll land on the same filtered list. Members still only see cases within their own access, so a shared link never exposes anything the recipient isn't allowed to view.
Assignment and ownership
Every case can have an assignee - the member who owns driving it forward. Assignment isn't a column in the list itself; you'll see and change it inside an individual case, where the assignee's name appears in the case header and can be updated from the case details panel. Only an Admin or Member can assign or reassign a case.
There are two ways a case gets an owner:
- Automatically, at intake. If auto-assignment is enabled in your Speak Up settings, each new report is assigned using round-robin among the members who are in scope for that case's category and have opted into auto-assignment. This spreads incoming reports evenly and means nothing lands unowned.
- Manually, any time. An Admin or Member can open a case and pick an assignee (or reassign it). Turning auto-assignment off leaves new cases unassigned until someone picks them up.
If a case shows Unassigned, it needs an owner. If it shows Unavailable member, the person it was assigned to no longer has active Speak Up access, and it should be reassigned. To see cases you own, open a case to confirm the assignee, or use the analytics and stage filters together to work through your team's queue.
Acknowledgment and feedback timelines (SLAs)
Speak Up tracks two time commitments on every case, so nothing quietly slips:
- Acknowledgment SLA - how quickly you promise to acknowledge a new report to the reporter. This is configured in days (the default is 7 days).
- Feedback SLA - how long you have to get back to the reporter with substantive feedback or an outcome. This is configured in months (the default is 3 months).
When a report is submitted, CultureMonkey stamps each case with an acknowledgment due date and a feedback due date based on these settings. A case counts as acknowledged the first time an admin acts on it, and its acknowledgment clock stops there. The feedback clock runs until the case is closed. You set these targets once for the whole program; see Set acknowledgment and feedback SLA targets.
Separately, each case can carry a manual Due date that an owner sets on the case, shown as a "Due" fact in the case header. Use it to flag your own internal deadline for a case, independent of the program-wide SLA targets.
Because the list sorts newest-first, the cases most at risk of breaching their feedback SLA - the oldest still-open ones - sit at the far end of the list. Filter out Closed (select just New, Triage, Investigation and Concluding) and page to the end, or sort by date, to check on anything that's been open a long time. That habit is the simplest way to keep long-running investigations from drifting past their deadline.
Tracking case volume and trends
For the bigger picture - how many concerns are coming in, of what type, and whether that's rising or falling - open the Analytics view from the chart icon in the case list header. It opens as a panel over the list and works off a date range you choose.
Analytics is on by default and available to Admins and Members. If you don't see the chart icon, check your Speak Up role.
The analytics view gives you:
- Total cases for the selected range, with a trend line comparing it to the equivalent prior period (for example, this quarter versus last quarter), shown with an up or down arrow and the change in count. This is your fastest read on whether reporting volume is climbing.
- A stage breakdown - how many of those cases are currently New, Triage, Investigation, Concluding or Closed - so you can see where work is piling up.
- Cases by category, drawn as horizontal bars and ordered by risk (critical categories first, then high, medium and low), each labeled with its risk badge and count. This shows you at a glance which kinds of concern dominate.
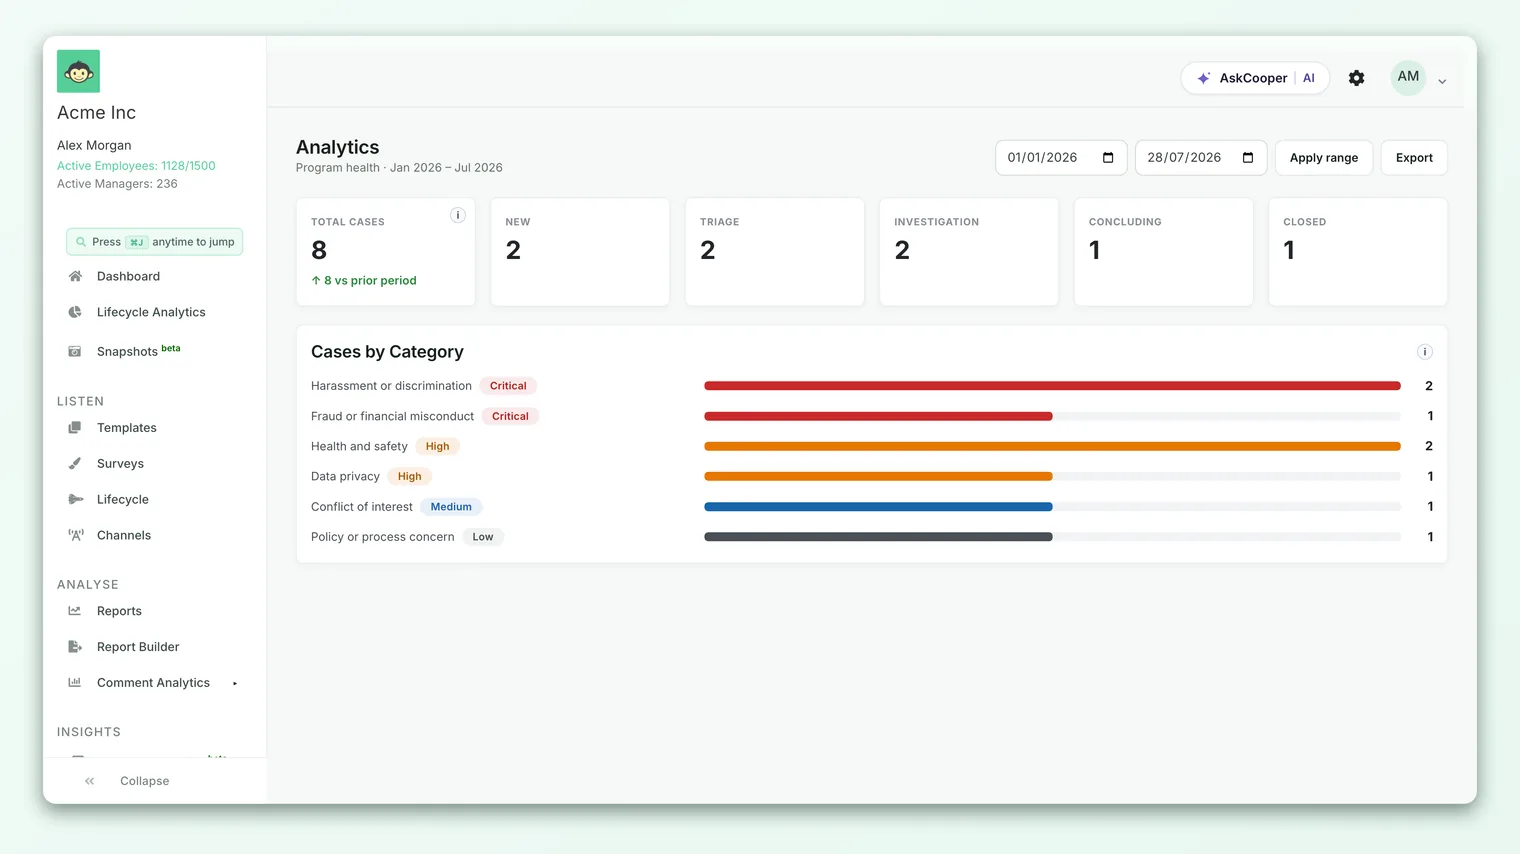
- 1Pick a range - set the from and to dates and click Apply range to recalculate every figure and the trend comparison.
- 2Read the trend - the arrow and number next to Total cases tell you how this period compares with the one before it.
- 3Scan by risk - the category bars are sorted so your highest-risk topics are always at the top.
- 4Export - click Export to download an Excel file of the analytics for the selected range, for board packs, audit trails or deeper offline analysis.
Rising volume isn't automatically bad news. A well-run Speak Up program often sees reports increase as trust grows and people believe raising a concern is safe and worthwhile. The signal to watch is the mix: a sudden spike in a single high-risk category, or a growing pile in Investigation that isn't reaching Concluding, is worth a closer look.
Best practices
- Start each day with a filtered view. Stage New plus Triage, sorted to the top, is your "needs a response" queue. Save the link as a bookmark.
- Let risk drive order. Because risk comes from the category, keep your category risk levels honest and accurate. That single setting shapes how the whole team prioritizes. See Manage Speak Up categories and risk levels.
- Don't let cases sit unassigned. An unowned case is a case no one is accountable for. Auto-assignment helps, but review for Unassigned and Unavailable member cases regularly.
- Check the tail of the list. The oldest open cases are the ones most likely to breach the feedback SLA. Filter out Closed and look at the end of the list weekly.
- Review analytics on a cadence. A monthly or quarterly look at volume, stage mix and category spread turns individual cases into program-level insight you can take to leadership.
Frequently asked questions
Why can't I see a case a colleague mentioned?
Almost always because it's in a category you don't have access to. Only an Admin sees every case; Members and Viewers see only their assigned categories. Ask a Speak Up Admin to check your category access if you believe you should see it.
Can I filter by assignee in the list?
Not directly from the list filters, which cover stage, category and risk level. The assignee is shown and changed inside each individual case. To work a specific owner's queue, combine stage and category filters and open cases to confirm ownership.
Does the list show which cases are overdue?
The list columns are Case, Category, Risk, Stage and Date of Creation, and the newest cases sit at the top. To find cases nearing their feedback deadline, filter out Closed and review the oldest open cases at the end of the list. CultureMonkey tracks acknowledgment and feedback due dates per case behind the scenes, and they drive reminders. See Set acknowledgment and feedback SLA targets.
Why is a case's risk level different from what I expected?
Risk is inherited from the case's category, not set on the case. If someone changed the category's risk level, every case in that category now shows the new level. Check the category's configuration if a badge looks off.
Who can see the analytics view?
Admins and Members. Analytics is on by default; Viewers and reporters don't have access to it.
Can I export the case data?
The CultureMonkey Analytics view exports a summary (total cases, stage breakdown and cases by category) as an Excel file for the date range you choose. It's built for reporting and audit, not for exporting the sensitive contents of individual cases.
Where to go next
- Understand the lifecycle: How Speak Up cases move through stages
- Set your response commitments: Set acknowledgment and feedback SLA targets
- Shape risk and access: Manage Speak Up categories and risk levels
Your feedback helps us improve the Help Center.