

Read the answer distribution on the Insights tab
How to read the Answer Distribution card on the Insights tab: unfavourable, neutral and favourable shares by section, question or driver, the diverging and stacked charts, sorting, and the average, favourable, unfavourable and loyalty columns.
On this page
The Answer Distribution card on the Insights tab shows how answers split, not just their average. Every rating answer is counted as unfavourable, neutral or favourable using your account's scale, and the card lays out that split for each section, question or driver of the survey.
Choose By Section, By Question or By Driver. Sort in Survey order, Lowest first or Highest first (by favourable share). Draw it Diverging (centered on neutral) or Stacked. Each row also lists the average, favourable and unfavourable shares, and loyalty where it applies.
This is the Insights tab's version. For the per-question distribution on the Questions tab, see View answer distribution.
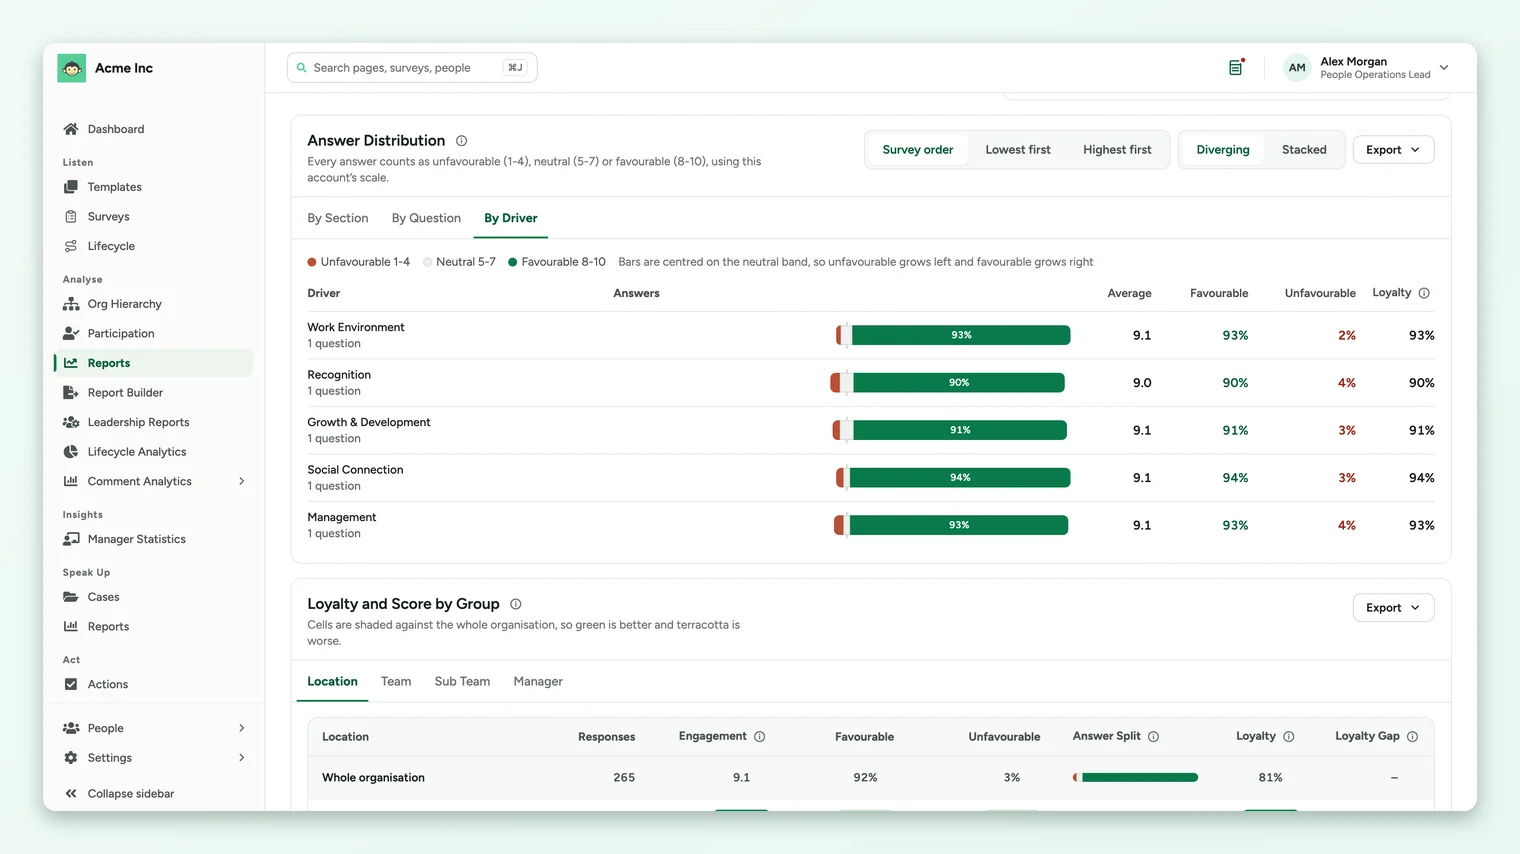
The three views
| View | Each row is | Good for |
|---|---|---|
| By Section | A section of the survey, as you built it. | Surveys organized by topic or stage, such as onboarding. |
| By Question | One rating question. In survey order, questions are grouped under their driver. | Finding the exact question behind a weak driver. |
| By Driver | A driver, with the number of questions in it. | Comparing topics on the same footing as the drivers chart. |
How answers are banded
The bands follow your account's scale and are named in the legend above the chart, and in the line under the card's title.
| Your account's scale | Unfavourable | Neutral | Favourable (the top band) |
|---|---|---|---|
| 1 to 10 (the default) | 1 to 4 | 5 to 7 | 8, 9 or 10 |
| 1 to 5 | 1 or 2 | 3 | 4 or 5 |
| Percentage | 1% to 49% | 50% to 79% | 80% to 100% |
Diverging or stacked
- Diverging centers each bar on the neutral band, so unfavourable grows to the left and favourable grows to the right. It makes a polarized result easy to spot.
- Stacked lines every bar up from the left, from unfavourable through neutral to favourable. It's easier for comparing favourable shares row by row.
The columns
| Column | What it shows |
|---|---|
| Answers | The bar showing the unfavourable, neutral and favourable split. |
| Average | The average answer on your account's scale. |
| Favourable | The share of answers in the favourable band. |
| Unfavourable | The share of answers in the unfavourable band. |
| Loyalty | By Section and By Driver only, on accounts with the loyalty score on: the share of respondents who gave a top-band answer to every question in that section or driver. |
Sort to find the weakest
Select Lowest first to bring the rows with the smallest favourable share to the top. In By Question, this lists every question across drivers from weakest to strongest, which is often the quickest way to find what to fix.
A row with a middling average can still have a large unfavourable share. Sort Lowest first, then scan the Unfavourable column for rows where a sizeable minority is clearly unhappy.
Export
The card's Export menu offers an Excel workbook or a CSV file for the view you're on, and an image of the chart. See Export from the Insights tab.
When nothing shows
If the card says Nothing here has enough responses to show, the whole selection has fewer responses than the survey's anonymity minimum. Clear a filter to widen it.
Your feedback helps us improve the Help Center.