

Use the Insights tab in a survey report
A complete guide to the Insights tab of a survey report: the headline numbers, the drivers chart, the loyalty card, the answer distribution and the group table, plus the filters, survey comparison and exports that apply to all of them, and who can see the tab.
On this page
The Insights tab is the one-page read of a survey. It sits inside every survey report, next to Report and Questions, and answers three questions without switching tabs: how the survey went overall, which drivers are holding it back, and which groups need attention first.
Open a survey report and pick Insights. Filter by business unit, location, team, sub team or manager (several groups at once if you like), and pick another survey under Compare with to see what changed. The page then shows headline numbers, a drivers chart, an answer distribution and a table of groups, all under the same filters. Groups below the survey's anonymity minimum never appear, and every export uses the filters you set.
What the Insights tab is for
- Get the whole story of one survey on one page, instead of reading the Summary, Report and Questions tabs separately.
- See what changed since the last survey, on the headline numbers and on each driver.
- Find the weakest drivers and groups and how far they sit from the overall result.
- Share a filtered view as an Excel workbook, CSV files or an image, ready for a leadership update.
Where to find it
- 1Go to Analyse > Reports and open a survey. See Open a survey report if you need help finding it.
- 2In the row of tabs under the survey's name, select Insights.
- 3The page loads its figures after the filter bar appears. On a large survey the loyalty score can take a few extra seconds and shows Calculating… until it is ready.
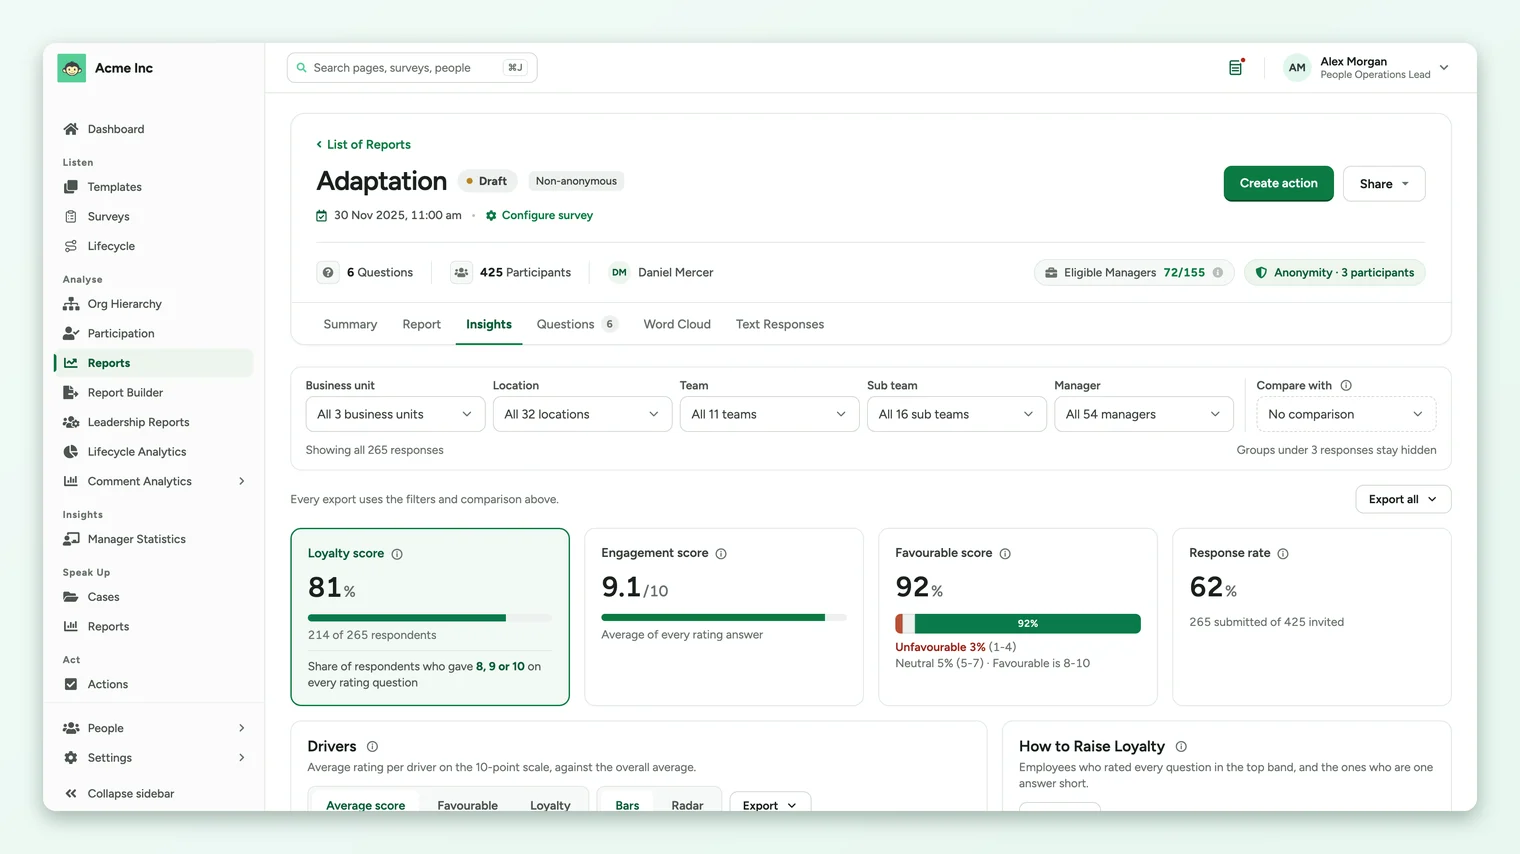
The tab is offered for any survey that has reached its minimum number of responses. A survey still under its minimum has nothing to show yet, so it is not listed.
Who can see it
| Role | What they get |
|---|---|
| Super Admin | The Insights tab on every survey report, for the whole organization, with every export. |
| Sub Admin | Only when the Insights for Sub Admins setting is on for your account. They see the people in their own access, the filters their report demographics allow, and image and table exports. They don't see the loyalty score, the Excel workbook or the chart CSV files. |
| Manager | No Insights tab. |
| Someone with a shared report link | No Insights tab. Shared links open the report without it. |
Insights for Sub Admins opens the tab to Sub Admins. Loyalty score adds the loyalty card, the Loyalty option on the drivers chart and the loyalty columns. CultureMonkey turns these settings on for your account. A Super Admin can ask their Customer Success Manager or CultureMonkey support to change them.
What's on the page
The page reads top to bottom, from the overall result down to individual groups. Each part has its own guide.
| Part | What it shows | Read more |
|---|---|---|
| Headline numbers | Engagement score, favourable score, response rate and, when it's on, the loyalty score, each with the change since the compared survey. | Headline numbers |
| Drivers | Every driver as a bar or on a radar, by average score, favourable share or loyalty, against the overall figure. | Compare drivers |
| How to Raise Loyalty | How many respondents are loyal, how many are one answer short, and the drivers holding the closest ones back. | Loyalty score |
| Answer Distribution | How answers split into unfavourable, neutral and favourable for each section, question or driver. | Answer distribution |
| Scores by Group | One row per business unit, location, team, sub team or manager, shaded against the whole organization. | Scores by Group |
Filter the page
The filter bar at the top has one control for each way your organization is grouped: Business unit, Location, Team, Sub team and Manager, plus Business group on accounts that use business groups. A control only appears when the survey has groups of that kind. Its menu lists the groups that have at least the survey's minimum number of people on the survey. A listed group can still have too few responses under your other filters, and picking it then shows no figures (see below).
- 1Select a filter, for example Location. A menu opens with a search box and a checkbox for each group.
- 2Type to narrow the list, then tick one group or several. Select all and Clear are at the top of the menu.
- 3Select Apply. The page reloads once with your selection. Cancel closes the menu without changing anything.
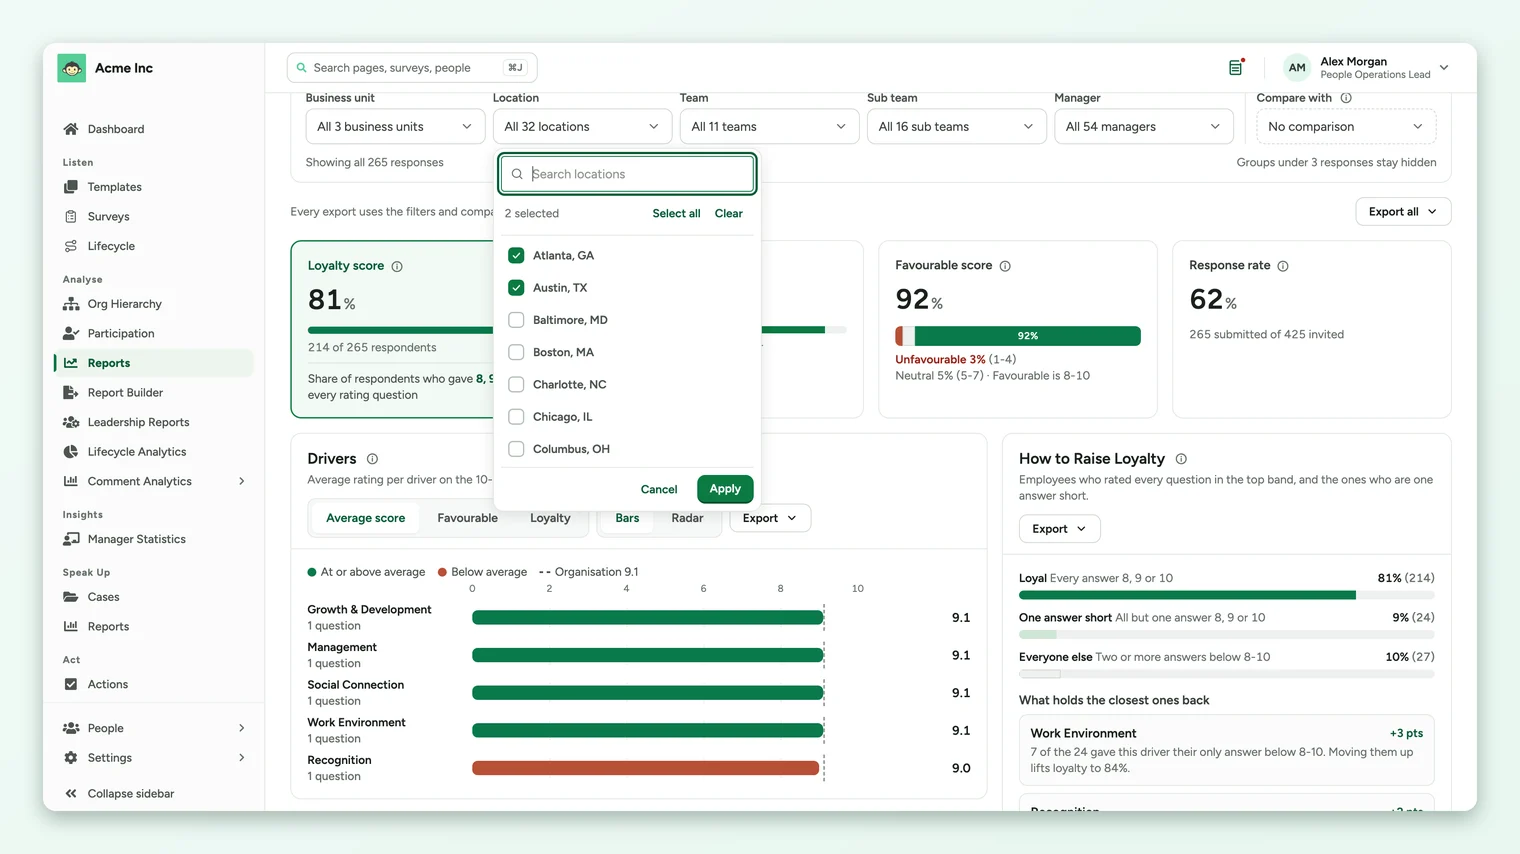
Under the filter bar, a line tells you how many responses the page is showing, and each active filter appears as a chip you can remove with its ×. Filters combine: picking two locations and one team shows people who are in either location and on that team.
If your filters narrow the page to fewer people than the survey's anonymity minimum, the page shows Not enough responses to show this selection instead of figures. The same happens when one of several picked groups is itself too small to report. Clear a filter or pick a larger group to see results. This protects the people in small groups from being identified.
Compare with another survey
Pick a survey under Compare with to see the change on the headline numbers and on the drivers chart. The list offers your other surveys that have reached their own minimum. A chip such as Compared with Adaptation Old confirms the comparison, and its × removes it.
- The comparison uses the same filters as the page, so a location filter compares that location in both surveys.
- If the compared survey has too few responses under your filters, the chip says too few responses to compare and no change is shown.
- Comparisons work best between waves of the same survey, because only drivers that exist in both surveys can be compared.
Sub Admins see their own access
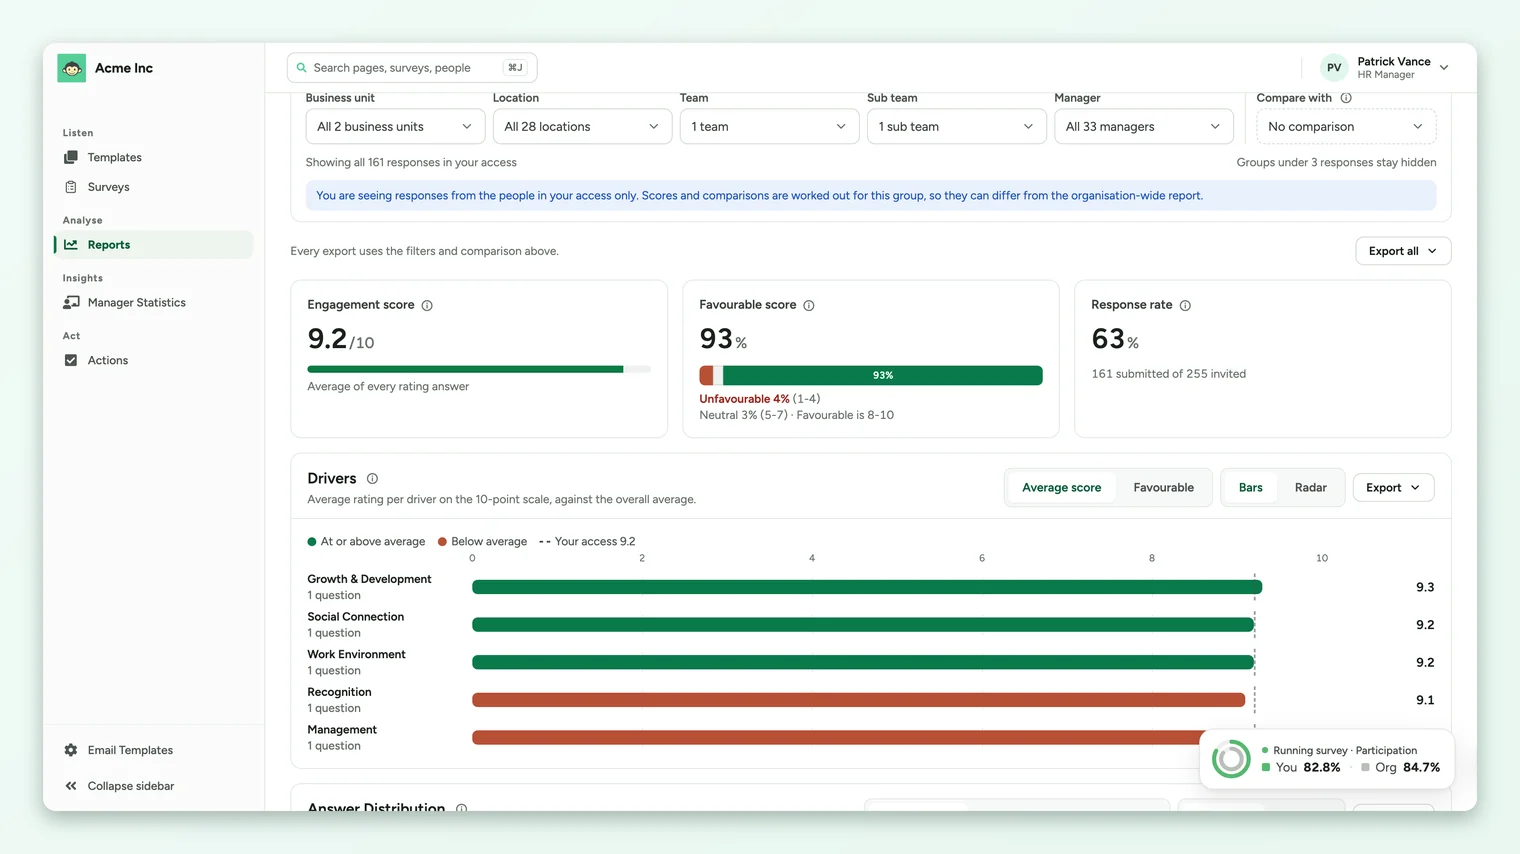
When a Sub Admin opens the tab, a note under the filters reads You are seeing responses from the people in your access only. Their figures, the overall line on the drivers chart and the first row of the group table are all worked out for that group, so they can differ from the organization-wide report a Super Admin sees. Their filters only offer the groups inside their access. See Restrict a sub-admin's data scope for how access is set.
How anonymity is protected
- Nothing appears for a selection with fewer responses than the survey's minimum. The minimum is shown on the right of the filter bar, for example Groups under 3 responses stay hidden.
- Groups below the minimum are left out of the group table, and filtering the page down to one shows no figures. People with no value for a grouping, such as no location, are left out of that grouping's table.
- Loyalty is counted from whole submissions without names, and a driver, section or group only gets a loyalty figure when enough respondents answered it.
- Exports follow the same rules as the page.
Where to go next
- Read the four cards at the top: Read the headline numbers on the Insights tab
- Find the drivers to work on: Compare drivers on the Insights tab
- Share what you found: Export from the Insights tab
- The tab isn't there or shows no figures: The Insights tab is missing or shows no results
Your feedback helps us improve the Help Center.