

Compare drivers on the Insights tab
How to read the Drivers card on the Insights tab: the average, favourable and loyalty views, bars and radar, the overall line, the compared survey's marks, and how to use it to choose what to work on.
On this page
A driver groups related questions, such as Recognition or Work Environment. The Drivers card on the Insights tab lines every driver up against the overall result, so the ones pulling the survey down stand out at a glance. New to drivers? Start with Understand drivers and factors.
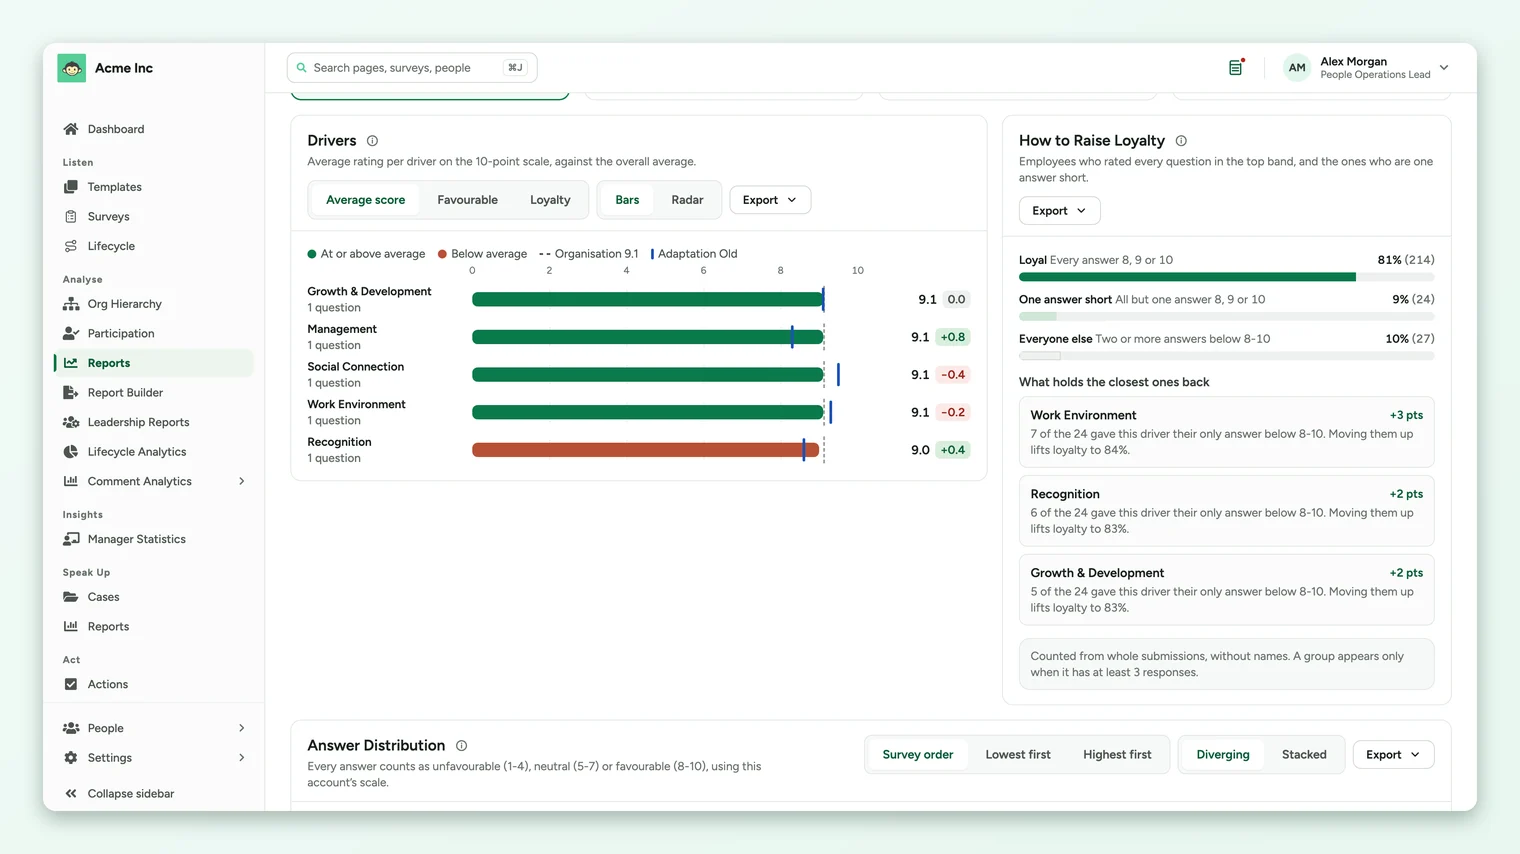
Pick what to compare (Average score, Favourable, or Loyalty when it's on) and how to draw it (Bars or Radar). Green drivers are at or above the overall figure, shown as a dashed line, and terracotta ones are below it. With a survey picked under Compare with, a blue mark shows where each driver was then, and a change appears beside each bar.
Choose what to compare
| Option | Each driver shows | Use it to |
|---|---|---|
| Average score | The average of every rating answer in the driver, on your account's scale. | See the level of each driver. |
| Favourable | The share of the driver's answers in the favourable band (8 to 10 on a 10-point scale). | See how widely positive people are about each driver. |
| Loyalty | The share of respondents who gave a top-band answer to every question in the driver. Shown only when the loyalty score is on for your account. | See which drivers stop people from being fully positive. |
The line under the card's title explains the current view, for example Average rating per driver on the 10-point scale, against the overall average.
Read the bars
- Each row is one driver, with the number of questions in it under its name.
- The dashed line is the overall figure for the page: the whole organization, everyone in your selection, or, for a Sub Admin, everyone in their access. The legend names it, for example Organisation 9.1.
- Green bars are at or above that line. Terracotta bars are below it.
- The blue mark on a bar is the compared survey's figure for that driver, and the change sits beside the number.
- When there are more drivers than fit, use the page controls under the chart.
Switch to the radar
Select Radar to see every driver at once as a shape. A balanced survey makes an even shape; a dent points to a weak driver.
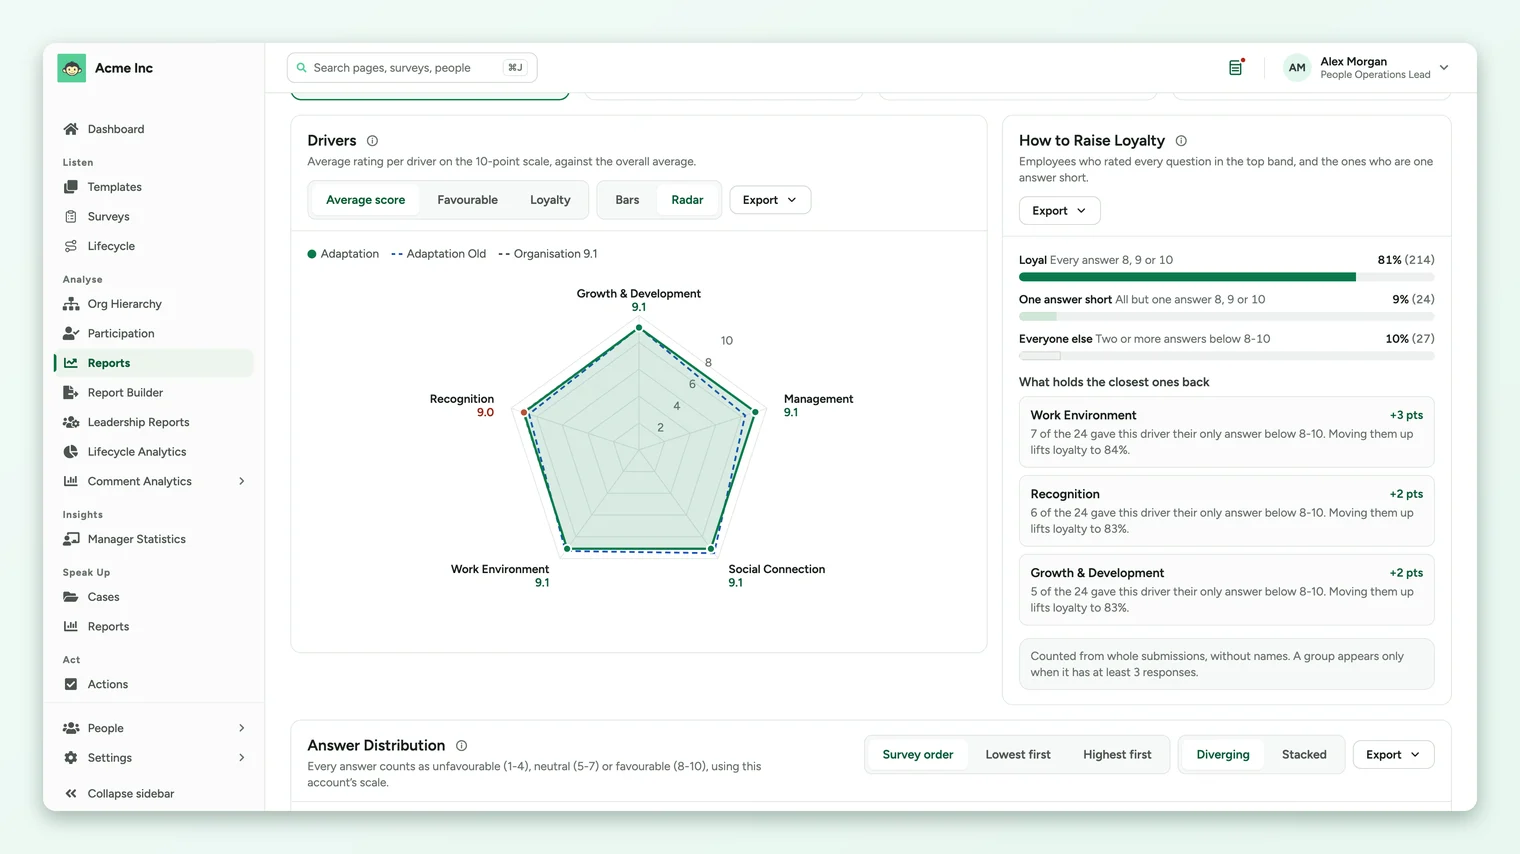
- The filled shape is this survey. The dashed outline is the overall figure.
- The compared survey is drawn as a blue outline when it has every driver this survey has. When it's missing some, it's drawn as rings on the drivers it does have, so a missing driver never reads as a score of zero.
Turn the chart into priorities
- 1Start with Average score to find the terracotta drivers furthest below the line.
- 2Switch to Favourable to check whether a low driver is low for most people or dragged down by a few very low answers.
- 3Check the change against your last survey. A driver that's both below the line and falling needs attention first.
- 4Open the questions behind it in the answer distribution, by driver, then by question.
- 5Find where it's lowest by filtering the page to a business unit or location, or reading the group table.
If a driver has only one question, its score is that question's score. Read that question's answers before drawing conclusions about the whole topic.
Export the chart
The card's Export menu offers an Excel workbook or a CSV file of the driver figures, and an image of the chart. Exports use the filters and comparison on the page. See Export from the Insights tab.
When drivers don't appear
If the card says No driver has enough responses to show, your filters have narrowed the page below the survey's anonymity minimum for every driver. Clear a filter to widen the group.
Your feedback helps us improve the Help Center.