

Understand Manager Statistics in CultureMonkey
A complete guide to the Manager Statistics leadership scorecard - what it measures, how managers are scored and segmented into buckets, where to find it, and how to act on what it shows. Currently in beta.
On this page
Manager Statistics is CultureMonkey's leadership scorecard. Instead of looking at your organization as one big number, it turns the lens on the people who shape day-to-day experience the most - your managers - and shows you, at a glance, which leaders have thriving teams, which are struggling, and what's driving the difference.
This guide covers what Manager Statistics measures, how each manager's score is calculated, how managers get sorted into performance groups (called "buckets"), where to find the page, and how to turn the view into action. It's written for account admins, since that's who can see it today.
Manager Statistics scores every manager on the average engagement their own team reports, then segments managers into groups such as high-performing ("hi-pot") and low-engagement, plus lenses like Women in Leadership and Millennial Managers. CultureMonkey builds it entirely from your survey data - your team's scores, their eNPS, and their feedback. The feature is currently in beta and is switched on per account.
What Manager Statistics is for
Most engagement dashboards answer the question "how is the organization doing?" Manager Statistics answers a sharper one: "how is each manager's team doing, and what does that tell us about the manager?"
That matters because managers are the single biggest lever on engagement. The experience an employee has - whether they feel recognized, supported, and heard - is largely shaped by the person they report to. When you can see engagement manager by manager, you can:
- Recognize your best leaders with evidence, not gut feel.
- Spot managers whose teams are quietly disengaging before it shows up as attrition.
- Learn what your strongest managers do differently and spread it.
- Focus coaching and support where it will move the needle most.
Manager Statistics doesn't replace your survey reports or the overall engagement score. It sits alongside them as a leadership-focused view built from the same underlying data.
The point of a leadership scorecard is to help managers grow, not to name and shame. The strongest results come when a low score starts a supportive conversation ("what's making this hard?"), not a disciplinary one.
What it measures
Every number on the page comes from your survey responses. Nothing is entered by hand or estimated. Three inputs do most of the work.
Team engagement score. For each manager, CultureMonkey averages the survey answers of the employees who report to that manager. Answers are on the standard rating scale, so a manager's score is effectively "the average score their team gave." A higher number means the team is, on balance, having a better experience under that manager.
eNPS of the team. Alongside the engagement score, the page can break a manager's team into Promoters, Passives, and Detractors using the same eNPS logic used everywhere else in the product. This tells you whether a team would recommend the organization as a place to work. For a full explanation of how that split works, see What is eNPS and how is it calculated?.
Driver scores and feedback. For each manager, the page also surfaces which engagement drivers (Leadership, Recognition, Work Life Balance, Wellness, Social Connection, and others) score highest or lowest for their team, plus representative comments pulled from that team's feedback. This is what turns a score into a story: not just "this team is disengaged," but "this team scores lowest on Recognition, and here's what they said."
How a manager is scored
The core score is deliberately simple so it's easy to trust:
> A manager's score = the average survey rating given by the employees who report to them.
Under the hood, CultureMonkey groups every survey answer by the responder's manager and takes the average per manager. That average is the manager's engagement score.
A single threshold then decides which side of the line a manager falls on. By default that threshold is 6 on the rating scale. Managers whose team score is at or above the threshold are treated as high-engagement; those below it are treated as low-engagement.
Managers are sorted by their exact score first, and only rounded for display afterwards. This is intentional: if scores were rounded first, a 9.7 and a 10.0 would look identical and could be ordered incorrectly. So the leaderboard order reflects the true underlying numbers, even when two managers show the same rounded figure.
A worked example
Say a manager, Priya, leads a team of eight. Their survey answers average out to 7.4. With the threshold at 6, Priya sits comfortably in the high-engagement group. The page also shows that her team's two strongest drivers are Recognition and Social Connection, and that most of her team are eNPS Promoters.
A second manager, Alex, leads a team whose answers average 5.1. That's below the threshold, so Alex lands in the low-engagement group. Here the page highlights the drivers scoring lowest for the team (say Work Life Balance and Leadership) and surfaces the critical comments behind them. Same data, same math - but now you know exactly where to start a coaching conversation.
How managers are grouped into buckets
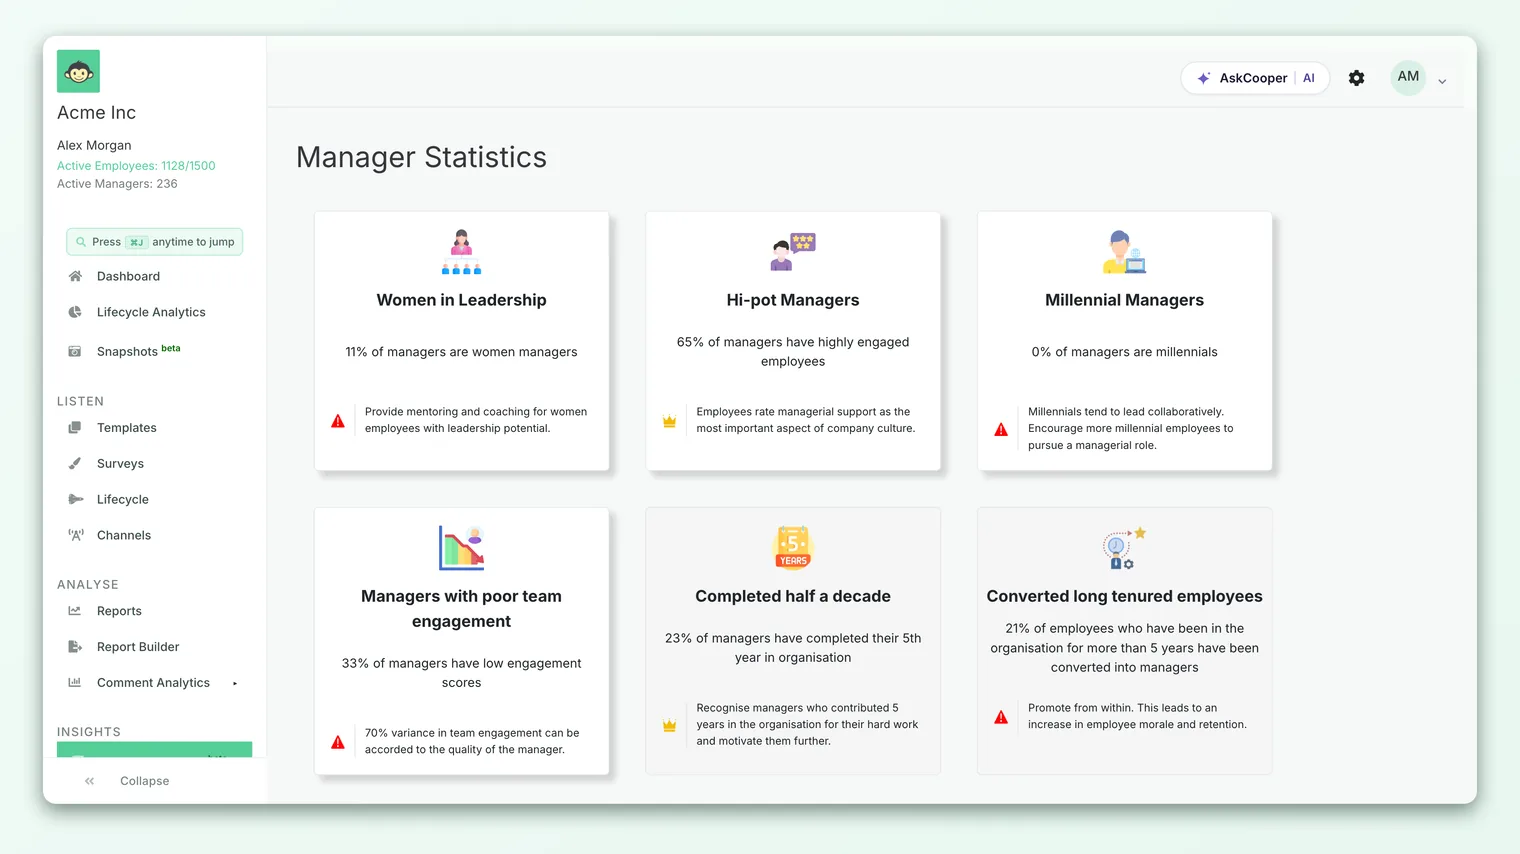
Beyond the single score, Manager Statistics segments managers into buckets - themed groups that each answer a different leadership question. On the main page, each bucket appears as a card with a headline insight (for example, "62% of managers have highly engaged employees"). Opening a card drills into the managers in that group, their driver strengths or weaknesses, and their team's feedback.
The buckets you may see include:
| Bucket | Who's in it | What it helps you do |
|---|---|---|
| Hi-pot Managers | Managers whose team score is at or above the threshold | Recognize and learn from your strongest leaders |
| Managers with poor team engagement | Managers whose team score is below the threshold | Prioritize coaching and support |
| Women in Leadership | Managers who are women | Track representation and how their teams score |
| Millennial Managers | Managers in the millennial age band | Understand how a fast-growing group of leaders performs |
Some accounts also see tenure and attrition lenses (for example, managers who've completed five years, or managers with high team attrition). Because buckets are configured per account, the exact set you see may differ. For a deeper walkthrough of what each group means and how to read it, see Understand manager performance buckets.
Inside the high-performing view there's a "People Champions" leaderboard that names the top manager for each engagement driver. It's designed for you to celebrate those leaders - a quick, specific email of thanks goes a long way and reinforces the behavior you want more of.
Where to find it
Manager Statistics lives in the left sidebar under an Insights section, labeled Manager Statistics with a small beta tag next to it.
The link only appears if two conditions are met: the feature is enabled for your account, and your role has permission to view it. If you don't see it, that's expected rather than a bug - more on that below.
Once you're in, the layout follows a simple pattern:
- 1Start on the overview - each bucket is a card with a headline stat and a benchmark note. This is your at-a-glance leadership picture.
- 2Open a bucket - click into a card to see the managers in that group, their strongest or weakest drivers, and the team feedback behind the numbers.
- 3View the manager list - each bucket has a full, paginated list of its managers with team, location, and reporting line, so you can find a specific person quickly.
- 4Use the leaderboard - in the high-performing view, the People Champions leaderboard highlights the top manager per driver for recognition.
Manager Statistics is in beta
This feature is currently in beta, which is why you'll see the small "beta" tag beside it in the sidebar. In practice, that means a few things worth knowing:
- It's switched on per account. Manager Statistics is enabled per account by CultureMonkey. Until it's turned on, the page and its sidebar link stay hidden. If your organization wants access, ask your CultureMonkey contact to enable it.
- The view keeps evolving. Because it's beta, the exact metrics, buckets, and layout may change as the feature matures. Some elements you might expect on a leadership scorecard (for example, a per-manager participation figure or an action-taking metric) may not be present in every account yet.
- The math is stable. The core scoring - average team rating, threshold-based grouping, eNPS split - is the same trusted logic used across CultureMonkey, so you can rely on the numbers even while the presentation evolves.
Who can see it
Access depends on both a plan-level setting and your role:
- The account setting must be on.
Manager Statisticsis gated by an account flag, off by default, and turned on by CultureMonkey for accounts on the beta. - Your role must permit it. In the current beta, viewing Manager Statistics is a full account admin capability. Survey admins and individual managers don't get this cross-organization leadership view.
An individual manager viewing their own dashboard sees their own team's results, not the ranked, all-managers view. If you want to understand what a single manager sees for their own team, use View results as a manager, which lets an admin preview the manager experience.
Reading the results well
A leadership scorecard is only as good as the judgment you bring to it. A few principles keep it fair and useful.
Mind the anonymity threshold. Like everything in CultureMonkey, manager-level results respect anonymity limits. A manager with a very small team may not show a score at all, because doing so could expose an individual's answer. An empty or hidden result usually means "not enough responses yet," not "score of zero." See Why can't I see results yet?.
A score is a starting point, not a verdict. A team of five that lost two members last month will look different from a stable team of twenty. Always read the drivers and feedback beneath the number before drawing conclusions about a manager.
Context changes everything. A manager who inherited a struggling team and lifted its score by a point is arguably doing better than one sitting on a comfortable inherited high. The scorecard shows a snapshot; the trend and the backstory tell you what it means.
Pair it with a conversation. The most valuable thing a low score can produce is a good one-on-one. The data tells you where to look; the manager tells you why.
How to act on it
Manager Statistics earns its keep when it changes what you do next.
- 1Celebrate your high performers. Use the leaderboard to send specific, personal recognition to managers whose teams are thriving. Being concrete ("your team scored highest on Recognition") makes it land.
- 2Learn what works and spread it. Look at the drivers your best managers score highest on and turn those into shareable practices - a short peer session or a written playbook.
- 3Support your struggling managers. For low-engagement teams, read the lowest drivers and the critical feedback together, then agree on one or two focused changes rather than a long list.
- 4Turn insight into action plans. Create concrete action plans with owners and deadlines for the biggest gaps, so the score has something to move against next cycle.
- 5Re-measure and watch the trend. Run your next survey or pulse and see whether team scores move. Improvement compounds over cycles, and a rising manager score is strong evidence coaching is working.
Frequently asked questions
How is a manager's score calculated?
It's the average of the survey ratings given by the employees who report to that manager. CultureMonkey groups every answer by the responder's manager and averages per manager. A configurable threshold (6 by default) then decides whether the manager is treated as high- or low-engagement.
What's the difference between a "hi-pot" manager and a low-engagement one?
It's the threshold. Managers whose team score is at or above the threshold fall into the high-performing (hi-pot) group; those below it fall into the low-engagement group. See Understand manager performance buckets for a fuller breakdown.
Why can't I see Manager Statistics in my sidebar?
Most likely one of two reasons: the feature isn't enabled for your account (it's a beta that CultureMonkey switches on), or your role doesn't have permission (it's an account admin view). If you believe it should be on, contact your CultureMonkey representative.
Can a manager see this page for all managers?
No. The organization-wide scorecard is an admin view. An individual manager sees only their own team's results on their own dashboard. To preview that experience yourself, use View results as a manager.
Why does a manager have no score?
Usually because their team is too small to meet the anonymity threshold, or too few people have responded yet. A hidden result protects individual responses; it isn't an error.
Is Manager Statistics finished?
Not yet - it's in beta. The scoring logic is stable, but the metrics, buckets, and layout may continue to change as the feature matures.
Where to go next
- Understand the groups in depth: Understand manager performance buckets
- See what a single manager sees: View results as a manager
- Learn the eNPS split behind the numbers: What is eNPS and how is it calculated?
- Turn findings into follow-through: Create an action
Your feedback helps us improve the Help Center.