

Read the Tags view and a tag's report
How to read question tags in a survey report: the Tags view under the Questions tab with each tag's score against the overall, Where to Look First, the grouped and ranked tag list, and a single tag's report with What This Tells You, its questions and the groups that score it lowest.
When a survey's questions carry question tags, its report gets a Tags view that scores each of your themes. From there you can open any tag for a full report: its score, its weakest question, and the groups that score it lowest.
Open the report's Questions tab and select Tags. The top shows how many tags sit below or above the survey's overall score and plots them on one line. Where to Look First names the lowest and strongest tag. The All Tags list has every tag's score, gap to the overall, questions and respondents. Open a tag to see What This Tells You, its questions lowest first, and who scores it lowest.
The Tags view appears on accounts with question tags on, for surveys where at least one question is tagged. CultureMonkey turns these settings on for your account. A Super Admin can ask their Customer Success Manager or CultureMonkey support to change them.
Open the Tags view
- 1Open the survey report and select the Questions tab.
- 2Above the questions, select Tags. The number beside it is how many tags the survey uses.
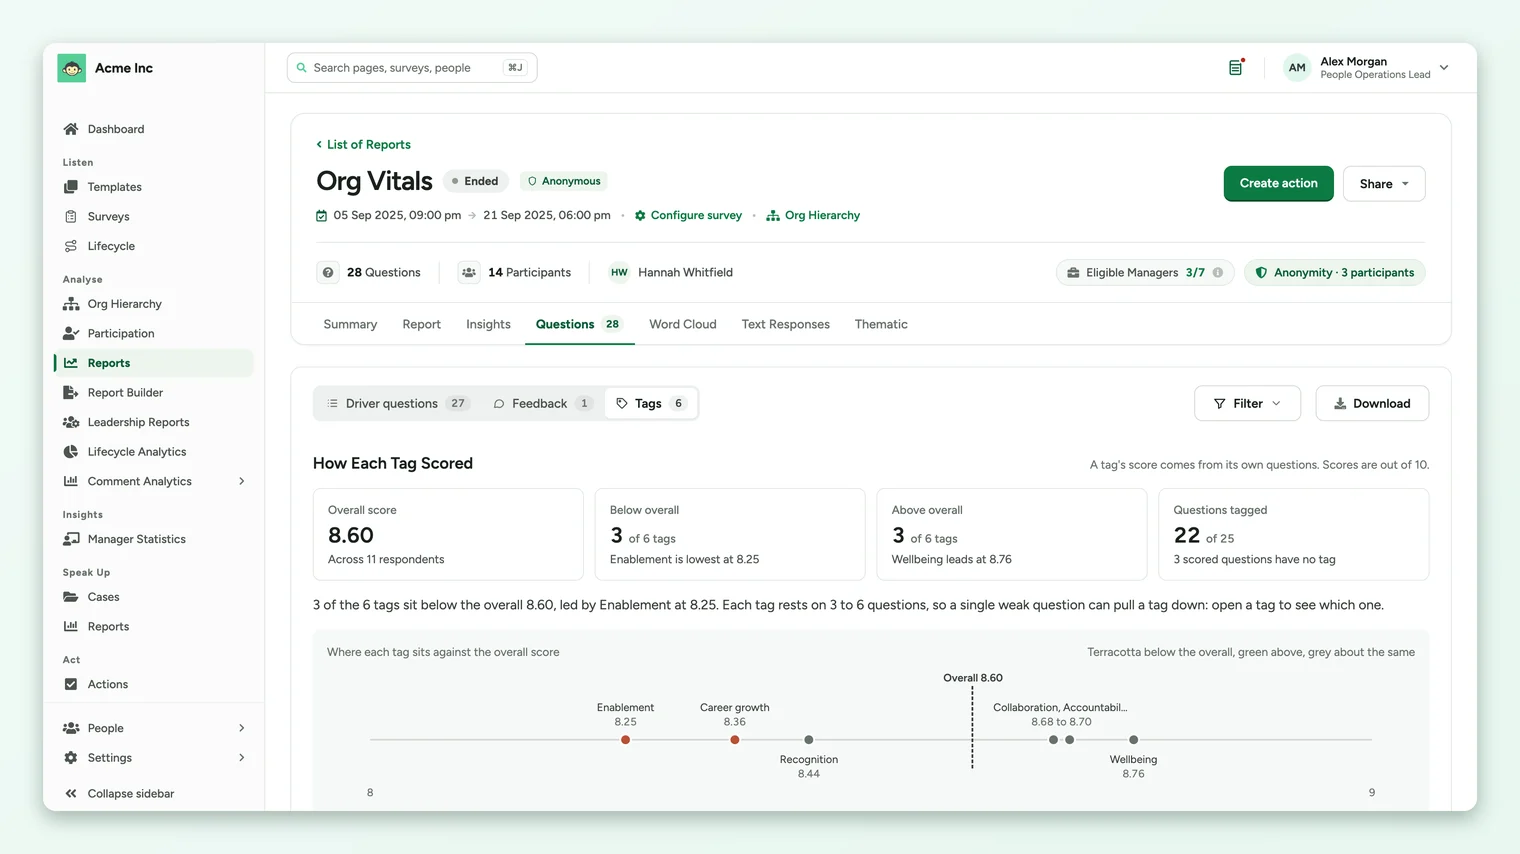
How Each Tag Scored
| Card | What it shows |
|---|---|
| Overall score | The survey's overall score and how many respondents it covers. |
| Below overall | How many tags score below the overall, and the lowest one. |
| Above overall | How many tags score above it, and the highest one. |
| Questions tagged | How many of the survey's scored questions carry a tag. |
A sentence under the cards sums it up, and a strip below plots every tag against the overall score: terracotta below it, green above it, grey about the same.
Where to Look First
Three quick picks from the list below: the Lowest Tag, the Strongest Tag, and, when you use parent and child tags, the Widest Split Under One Tag, where two tags under the same parent differ most. A parent's own score can hide a weak child, so this pick points at it. Each card links straight to that tag.
All Tags
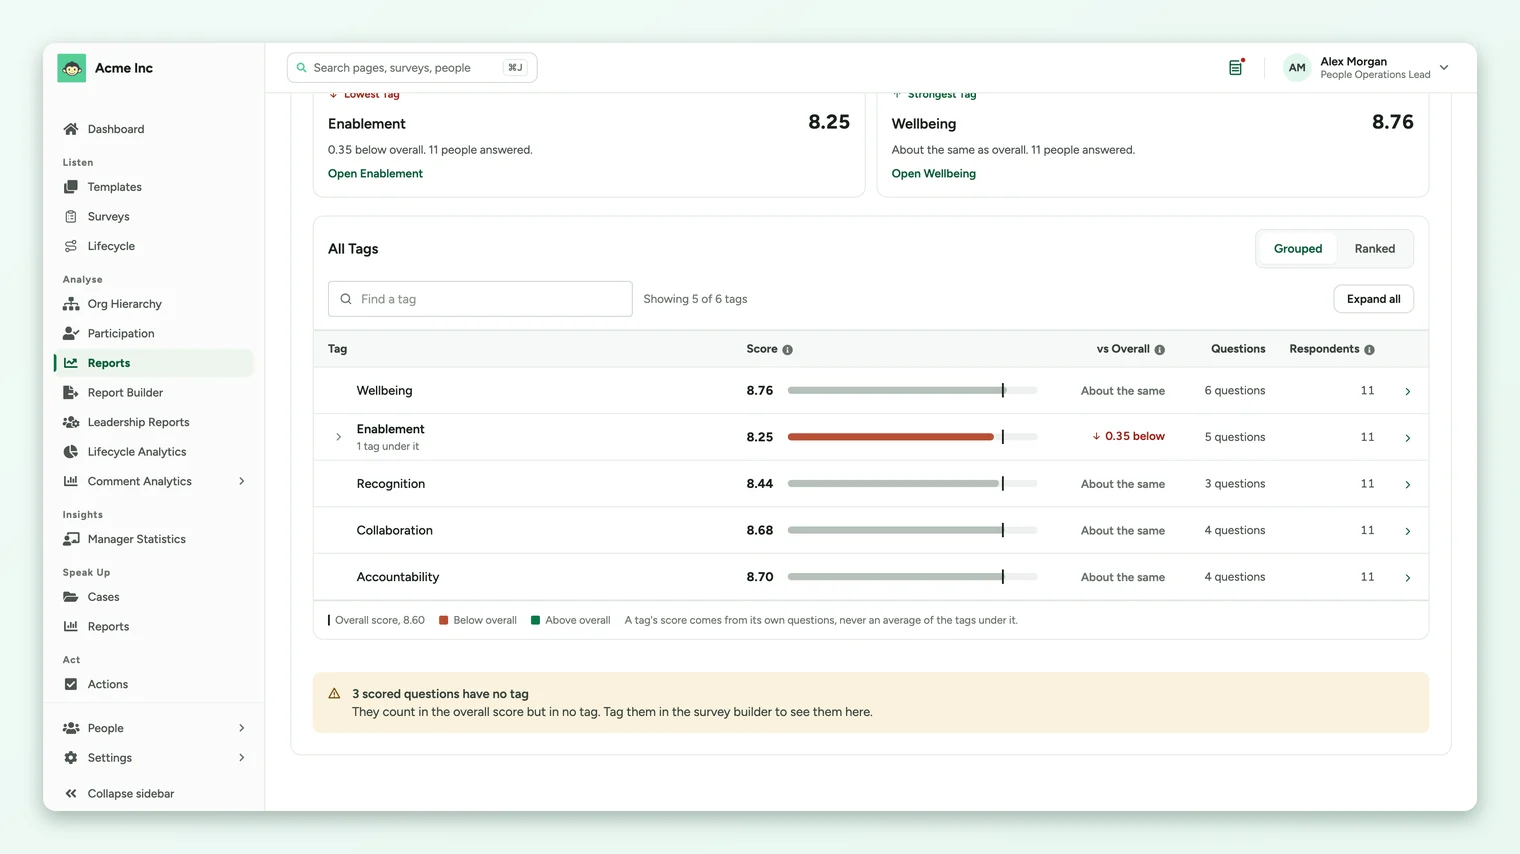
| Column | What it shows |
|---|---|
| Score | The tag's score, with a bar and a line marking the overall score. |
| vs Overall | The tag's score minus the survey's overall score. Grey means about the same. |
| Questions | How many questions carry the tag. |
| Respondents | How many people answered at least one of its questions. |
- Grouped shows parent tags with their children under them. Use the arrow or Expand all to open them.
- Ranked lists every tag in one table by score.
- Find a tag narrows the list by name.
- Filter adds a column for each group in a demographic you pick, with each group's score and gap to the tag score. A dash means too few people in that group answered.
- A note under the list tells you when some scored questions have no tag. They count in the overall score but in no tag.
A tag's report
Select a tag to open its report.
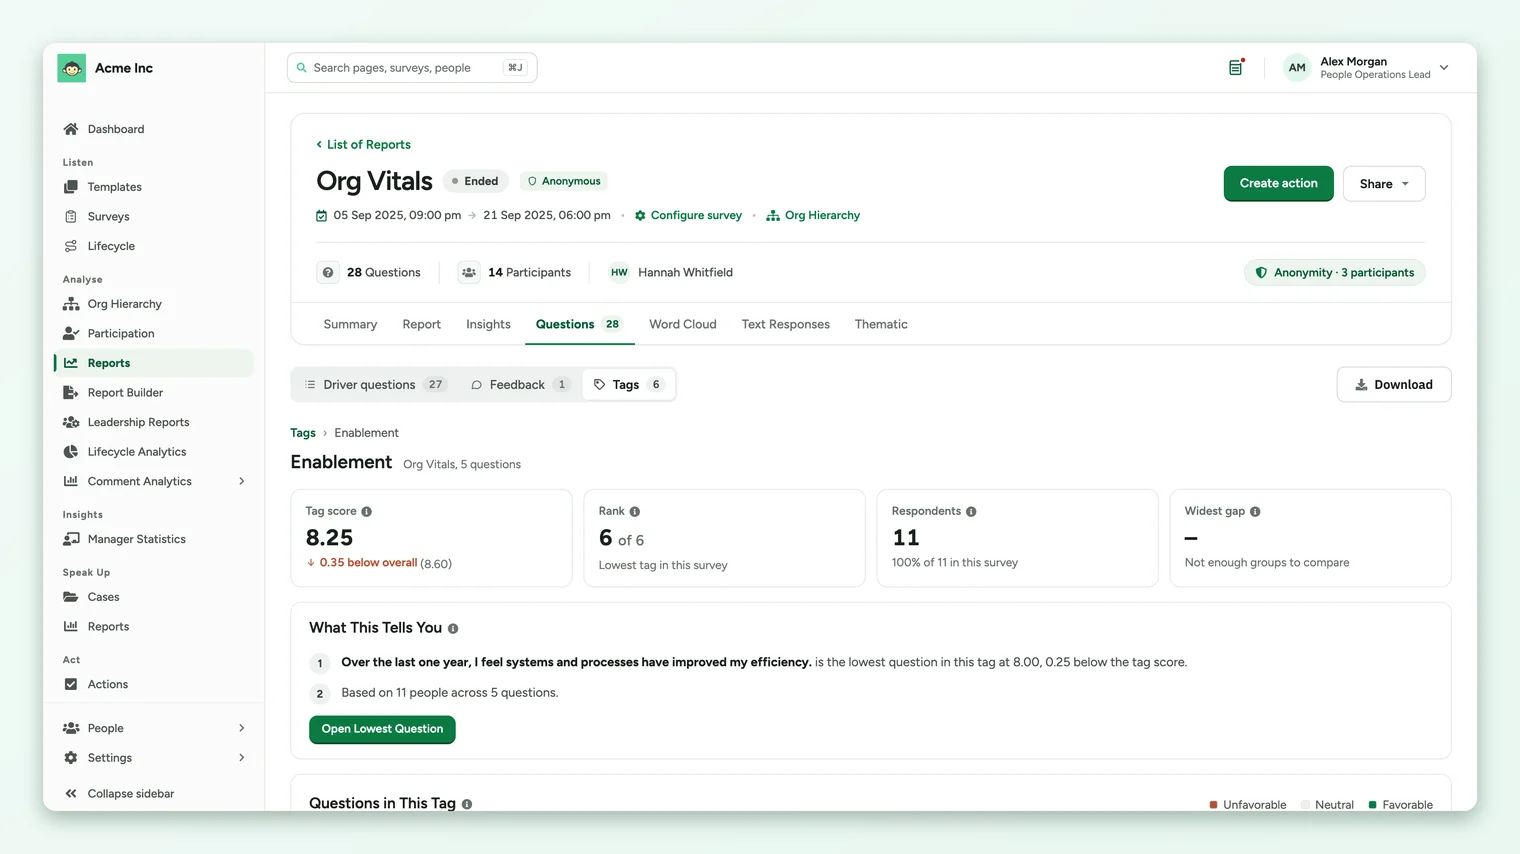
| Card | What it shows |
|---|---|
| Tag score | The tag's score and how far it sits above or below the overall. |
| Rank | Where the tag sits among all tags in the survey, highest first. |
| Respondents | People who answered at least one question in the tag, and their share of the survey's respondents. |
| Widest gap | The gap between the lowest and highest group for the demographic you pick. Small groups are left out. |
What This Tells You
A plain reading of the tag: its lowest question and how far below the tag score it sits, the group that scores the tag lowest for the demographic you pick, and how many people and questions the score rests on. Open Lowest Question takes you to that question's results. When a tag has a single question, it says so, because its score is then that one question's score.
Questions in This Tag
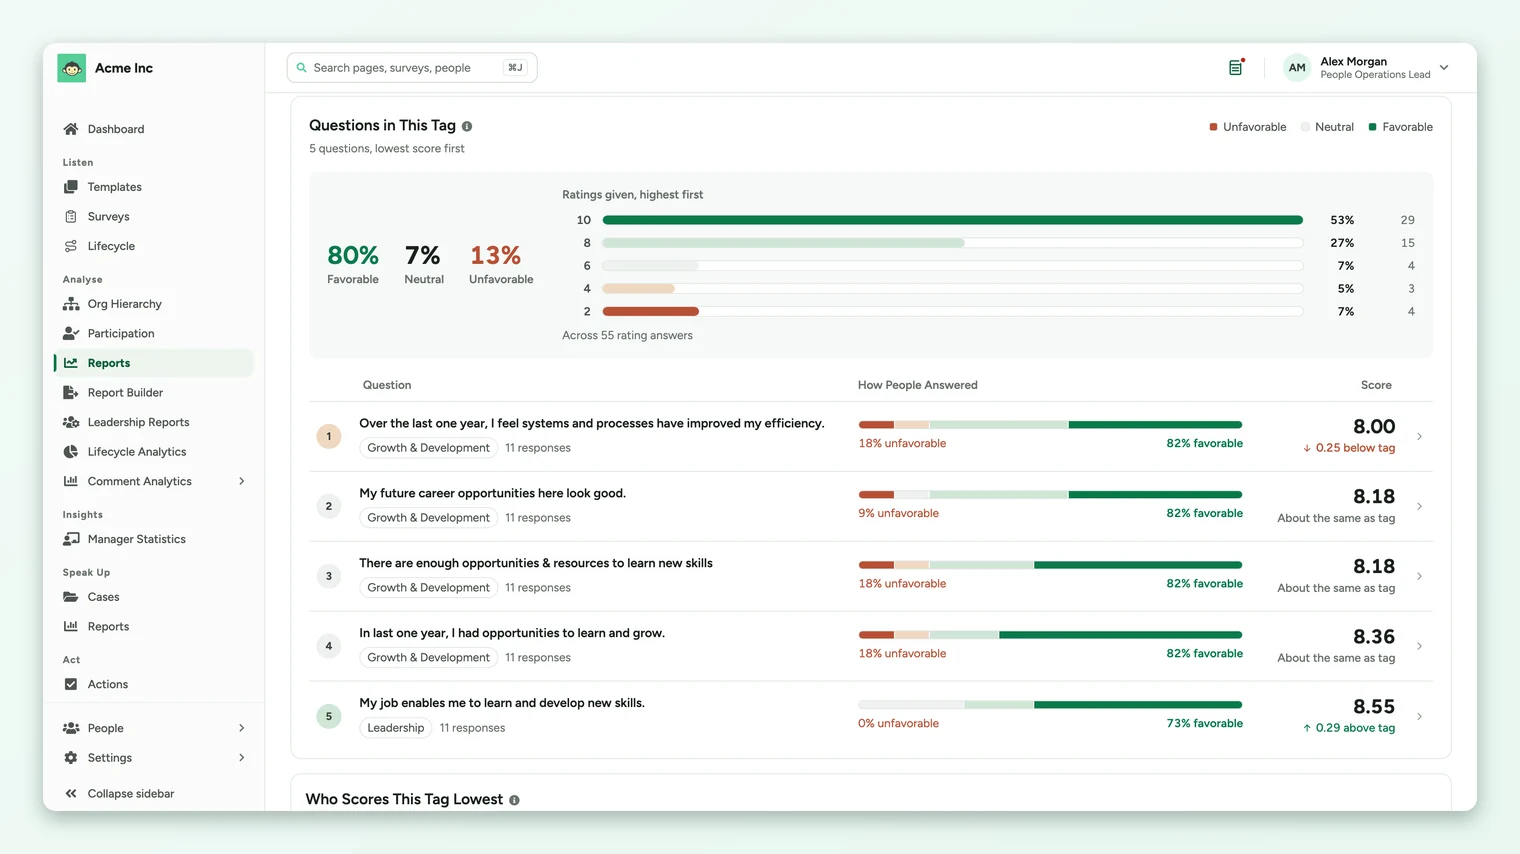
The tag's questions, lowest score first. A summary shows the favorable, neutral and unfavorable shares across the tag and how ratings were given. Each question shows its driver, its responses, how people answered, and its score against the tag score.
Who Scores This Tag Lowest
The tag's questions split by one demographic at a time, so you can see which teams, locations or other groups score the theme lowest. A group appears only when at least the survey's minimum number of people in it answered.
Download
- In the Tags view, Download gives an Excel workbook of every tag: a summary, the tags, their questions and scores by attribute.
- In a tag's report, Download gives a workbook of that tag: a summary, its questions, answers and scores by attribute.
- Small groups are left out of both.
When you open a cell in the report's heatmap, the drill-down lists the questions and tags behind it, so you can see which theme is weakest for that group. See Read a heatmap.
Your feedback helps us improve the Help Center.