

Compare scores across regions in CultureMonkey
How to use the regional benchmark filter in CultureMonkey to compare your driver and eNPS scores against region-specific benchmark data, and how to read the results.
On this page
Benchmarking answers a simple, important question: is this score actually good? A driver score of 7.2 feels fine in isolation, but it means something very different if the typical employer in your industry scores 6.5 versus 8.0. The regional benchmark filter sharpens that comparison further by letting you measure your scores against benchmark data for a specific region of the world, rather than a single global average. CultureMonkey applies that filter to its benchmark data, so you compare against a chosen region rather than a single global average.
This guide covers what regional benchmarking is in CultureMonkey, when to reach for it, how to turn it on and use it, and how to read the results without drawing the wrong conclusion.
Regional benchmarking is an option on your Benchmark report. Once enabled, a Filter By Region dropdown appears above the benchmark table. Pick a region (such as EU, NA, LATAM, APAC, or MEA) and CultureMonkey compares the scores for that region against benchmark data for the same region, matched to your industry. Leave it on All Regions for the standard global comparison.
Regional benchmarks vs industry benchmarks
Regional benchmarking is not a separate report. It's a facet of the Benchmark report, which normally compares your scores against a global industry benchmark. For the full picture of how the underlying benchmark table, driver gaps, and suggested actions work, start with Compare against industry benchmarks. This article focuses on the region layer that sits on top of it.
The distinction is worth holding onto:
| Industry benchmark | Regional benchmark filter | |
|---|---|---|
| Compares against | A global benchmark for your industry and employee size | A benchmark for a specific region, still matched to your industry |
| Where it lives | The Benchmark report, default view | The same report, via the Filter By Region dropdown |
| What "your score" means | Your whole organization | Your employees located in the chosen region |
| Best for | An overall "how do we stack up" read | Fairer comparisons for multi-region organizations |
In short, the regional filter changes both sides of the comparison at once: the benchmark you're measured against, and the slice of your own people being measured.
Why compare by region
Employee sentiment doesn't sit at the same baseline everywhere. Rating tendencies, labor markets, workplace norms, and expectations around pay, flexibility, and recognition all differ across regions. A global benchmark averages over all of that, which can quietly mislead you in two directions:
- It can flatter a region. Your EU teams might look strong against a global average while trailing their actual EU peers.
- It can penalize a region. Your APAC teams might look weak against a global average when they're right in line with regional norms.
Regional benchmarking helps in a few concrete situations:
- Multi-region organizations that want each region judged against a fair local peer set, not a single worldwide number.
- Regional HR or people leaders who need to know how their population compares to the market they actually hire in.
- Prioritizing action where the gap is genuinely largest once local expectations are accounted for, rather than where a global average happens to make things look bad.
The benchmark is always matched to your account's industry first, then narrowed to the region you pick. You're comparing like with like: employers in your industry, in that part of the world.
How the comparison works
Under the hood, CultureMonkey uses a set of standard regions to keep benchmark data consistent. The regions are EU (Europe), NA (North America), LATAM (Latin America), APAC (Asia-Pacific), and MEA (Middle East and Africa). Your organization can map these standard regions to whatever names you use internally, so the dropdown may show your own labels.
When you select a region, two things happen at once:
- 1The benchmark switches. Instead of the global industry benchmark, the table loads the benchmark scores recorded for that region, still filtered to your industry (and employee size, where available).
- 2Your scores are refocused. "Your score" is recalculated using only employees whose office location belongs to that region. So you're comparing your EU population against the EU benchmark, not your whole company against the EU benchmark.
This two-sided switch is what makes the comparison meaningful. If only the benchmark changed, you'd be comparing your global average against a regional target, which would be misleading. Because your own population is filtered to match, the two numbers are genuinely comparable.
Refocusing your scores relies on employees being tied to office locations that are assigned to a region. If your locations aren't mapped to regions, a selected region can return "No data found for the chosen region," even though the benchmark itself exists. See Manage office locations to check your setup.
Turning on the regional filter
The Filter By Region control is an account-level option, not something every account has switched on by default. There are two independent switches, one for each benchmark type:
- Regional driver benchmark - adds the region filter to the main Benchmark report (driver and overall scores).
- Regional eNPS benchmark - adds the region filter to the eNPS benchmark view.
If you don't see a Filter By Region dropdown on your Benchmark report, the setting hasn't been enabled for your account. Reach out to your CultureMonkey contact or support to have it turned on, and to confirm that your regions are mapped to your locations.
Enabling the regional benchmark filter and mapping regions to locations is handled at the account level, typically by your CultureMonkey customer success contact. Once it's on, any Survey Admin who can open the Benchmark report can use the filter.
Reading a regional comparison
With the filter enabled, open any survey's Benchmark report from Analyse > Reports. You'll see the Filter By Region dropdown above the benchmark table, defaulting to All Regions.
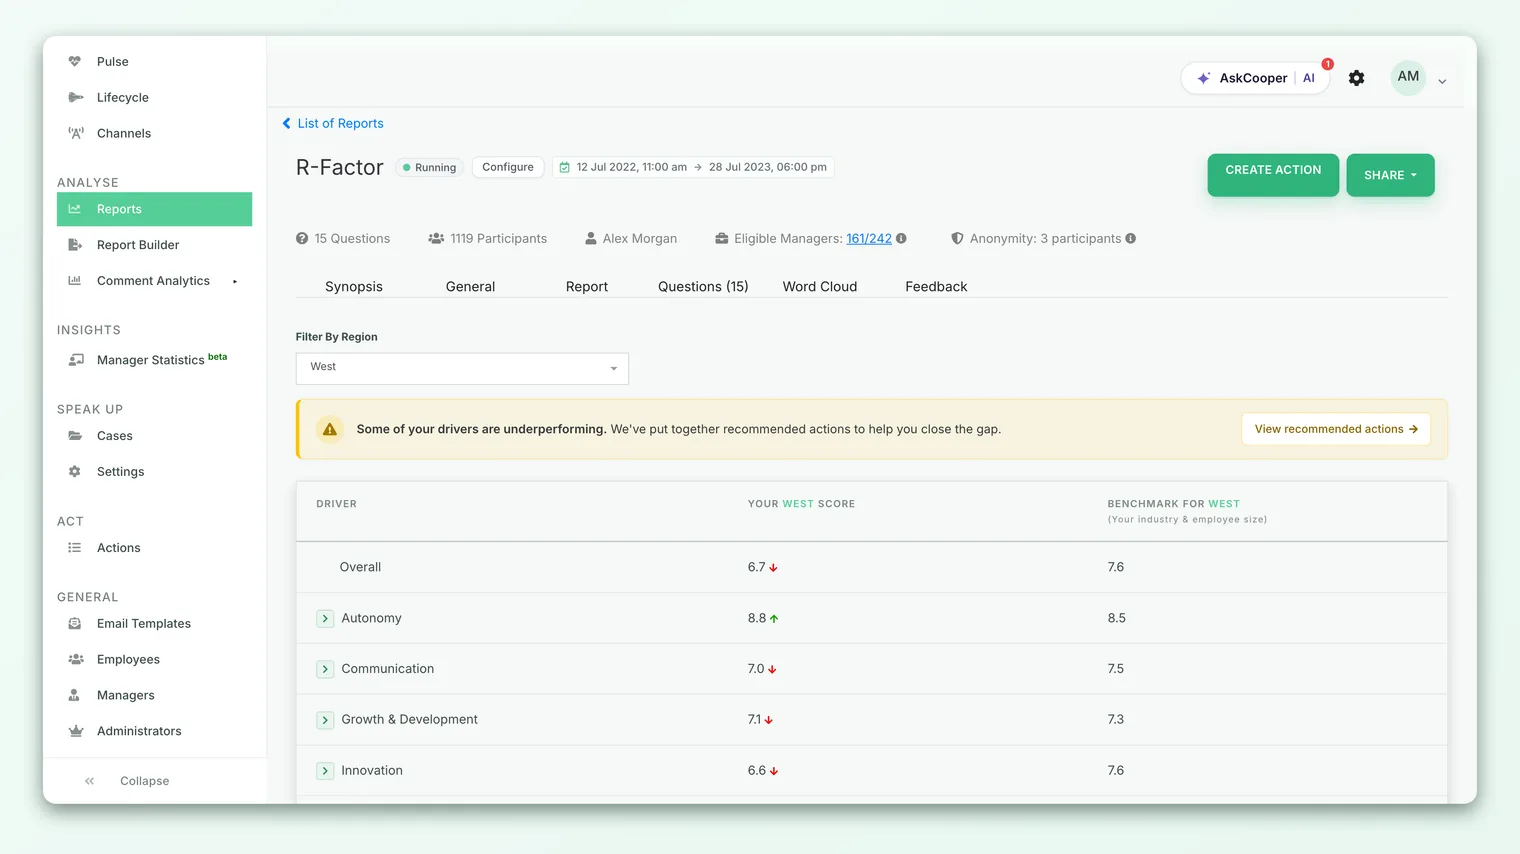
To run a regional comparison:
- 1Open the Benchmark report for the survey you want to analyze.
- 2Choose a region from the Filter By Region dropdown. The table reloads without a full page refresh.
- 3Read the columns. Each row is a driver (plus an Overall row). "Your [region] Score" is that region's population; the Benchmark column is the regional benchmark for your industry.
- 4Return to global by selecting All Regions whenever you want the standard industry comparison back.
Once a region is selected, the column headers update to name it, so it's always clear which region you're looking at. The table shows each driver side by side with its regional benchmark, and the drivers with the largest gaps below benchmark are the ones surfaced for suggested actions.
Reading the eNPS regional view
The eNPS benchmark view works the same way, with its own Filter By Region dropdown. Here the table compares your eNPS score for the selected region against the eNPS benchmark for your industry in that region. If eNPS is new to you, What is eNPS and how is it calculated? explains the score itself.
Comparing your own regions against each other
The regional filter compares each region against external benchmark data, one region at a time. It is not a single side-by-side view of all your regions at once. To compare your own regions to each other, you have two complementary options:
- Switch the filter region by region. Run the benchmark for EU, note the scores, switch to NA, and so on. Because each is compared to its own regional benchmark, you're seeing how far above or below its local market each region sits, which is often a fairer internal comparison than raw scores.
- Group scores by demographic. To put your regions directly next to each other in one view, use Group scores by demographic and group by location or region. That gives you an internal, region-versus-region breakdown without any external benchmark attached.
Ask "how does each region compare to its market?" and use the regional benchmark filter. Ask "how do our regions compare to each other?" and use the demographic grouping. They answer different questions and are stronger together.
Best practices
- Match the region to the audience. When you're briefing a regional leader, filter to their region so the comparison reflects the market they actually operate in.
- Watch gaps, not just absolutes. A region scoring 6.8 against a 6.5 regional benchmark is doing better than one scoring 7.4 against a 7.6 benchmark, even though the raw number is lower.
- Confirm your location mapping first. Regional "your score" figures are only as accurate as your employee location data. Clean location data is a prerequisite, not an afterthought.
- Use global and regional together. The global industry view tells you where you stand overall; the regional view tells you where you stand locally. Read both before deciding where to act.
- Mind small regions. A region with few respondents may fall below the anonymity threshold and show no data. That's protection, not an error. See Why can't I see results yet?.
Even a region-specific benchmark is an average across many employers. Treat it as orientation, not a target to hit. The trend in your own scores over time is a more reliable signal than any single gap to a benchmark.
Limitations and caveats
Regional benchmarking is genuinely useful, but it has boundaries worth knowing:
- It's opt-in. The filter only appears if the regional benchmark setting is enabled for your account. Without it, you'll only see the standard global comparison.
- It depends on location mapping. If your employees' locations aren't assigned to a region, the "your score" side can come back empty even when benchmark data exists.
- Benchmark coverage varies. Not every industry-and-region combination has benchmark data. A region may return no benchmark rows if the sample behind it isn't large enough to publish.
- One region at a time. The filter compares a single region against its benchmark per view. It doesn't stack all your regions into one comparison table.
- It's a snapshot. Benchmarks reflect a point in time and update periodically, not continuously.
Frequently asked questions
Why don't I see a Filter By Region dropdown?
The regional benchmark filter is an account-level option. If it isn't visible on your Benchmark report, it hasn't been enabled for your account yet. Contact your CultureMonkey representative or support to switch it on.
What regions are available?
CultureMonkey uses a standard set of regions: EU, NA, LATAM, APAC, and MEA. Your account may display these under your own internal names if your regions have been mapped to custom labels.
When I pick a region, whose scores am I seeing?
Both sides change. The benchmark becomes the one for that region and your industry, and "your score" is recalculated using only employees whose office location belongs to that region, so the two numbers are directly comparable.
It says "No data found for the chosen region." What's wrong?
Usually one of two things: your employees' locations aren't mapped to that region (so there's nothing on your side to score), or there isn't published benchmark data for that industry-and-region combination. Check your office locations first.
Can I compare all my regions in one table?
Not through the benchmark filter, which handles one region at a time against its external benchmark. To put your regions side by side internally, use Group scores by demographic and group by location or region.
Does regional benchmarking work for eNPS too?
Yes. The eNPS benchmark view has its own Filter By Region dropdown, enabled by a separate setting, and works the same way as the driver benchmark filter.
Where to go next
- Start with the fundamentals: Compare against industry benchmarks
- Compare your own regions internally: Group scores by demographic
- Check your location setup: Manage office locations
- Understand the eNPS number: What is eNPS and how is it calculated?
Your feedback helps us improve the Help Center.