

Understand the loyalty score and How to Raise Loyalty
What the loyalty score on the Insights tab measures, how the How to Raise Loyalty card splits respondents into loyal, one answer short and everyone else, how to read the drivers it names and the points each could add, and who can see it.
On this page
Averages can hide how many people are fully positive. The loyalty score answers that directly: what share of respondents gave a top-band answer to every rating question. The How to Raise Loyalty card then looks at the people who came closest and names the drivers that kept them out.
A respondent is loyal when every rating answer they gave is in the top band (8, 9 or 10 on a 10-point scale). One answer short means all but one answer was in the top band. The card names up to three drivers where that one lower answer most often sits, and how many loyalty points the score would rise if those respondents moved that answer up.
The loyalty score appears for Super Admins on accounts with the Loyalty score setting on. Sub Admins don't see it, even when it's on. CultureMonkey turns these settings on for your account. A Super Admin can ask their Customer Success Manager or CultureMonkey support to change them.
How the loyalty score is worked out
CultureMonkey looks at each submission as a whole. A respondent counts as loyal when none of their rating answers fell below the top band of your account's scale:
| Your account's scale | Every answer must be |
|---|---|
| 1 to 10 | 8, 9 or 10 |
| 1 to 5 | 4 or 5 |
| Percentage | 80% or higher |
The loyalty score is the share of respondents who are loyal, under the filters at the top of the page. Questions a respondent didn't answer, such as optional questions they skipped, don't count against them.
The favourable score counts answers, so one person with nine favourable answers and one neutral one adds nine favourable answers. The loyalty score counts people, and that same person isn't loyal. A gap between the two tells you how many people are positive about most things but held back by one or two.
Read the How to Raise Loyalty card
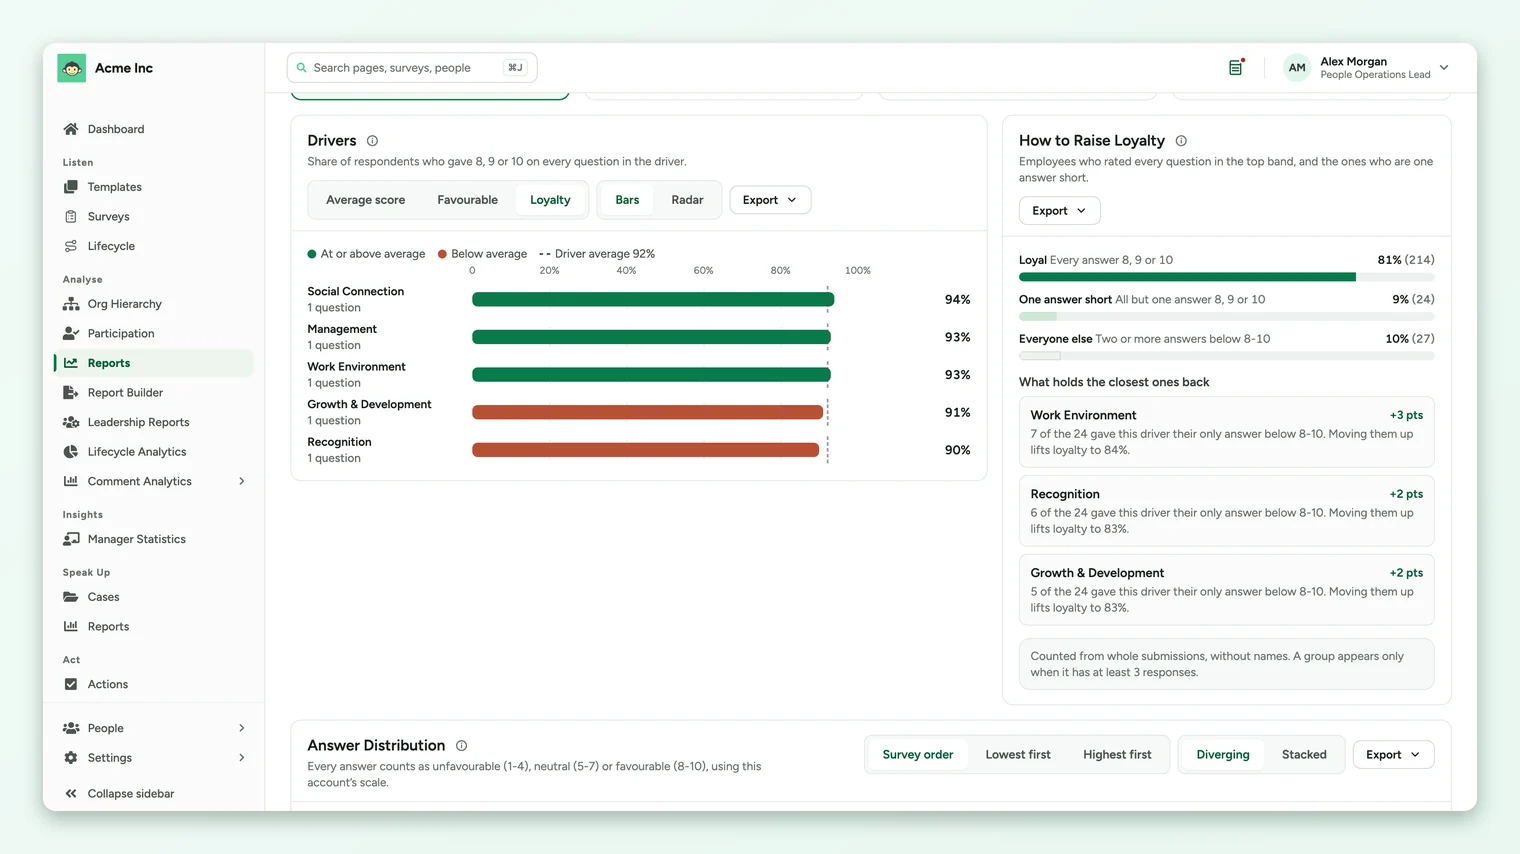
The card has two parts.
Three groups of respondents
- Loyal: every answer in the top band.
- One answer short: all but one answer in the top band. These are the people closest to loyal.
- Everyone else: two or more answers below the top band.
Each group shows its share of respondents and, when the group is large enough, the number of people in it.
What holds the closest ones back
For the people who are one answer short, CultureMonkey finds which driver their one lower answer belongs to, and lists up to three drivers, most common first. Each one reads like this:
Work Environment, +3 pts. 7 of the 24 gave this driver their only answer below 8-10. Moving them up lifts loyalty to 84%.
The points are what the loyalty score would gain if those respondents gave that one answer in the top band. That makes the list a short, ranked set of places where a focused change could move the most people from nearly loyal to loyal.
- A driver is only named when it holds back at least as many people as the survey's anonymity minimum. If none does, the card says No single driver holds back at least 3 of them (with your survey's minimum).
- When nobody is one answer short, the card says Nobody is one answer short.
Loyalty elsewhere on the page
- Drivers chart: pick Loyalty to see, for each driver, the share of respondents who gave a top-band answer to every question in it. See Compare drivers
- Answer distribution: the By Section and By Driver views add a Loyalty column.
- Group table: becomes Loyalty and Score by Group, with a Loyalty column and a Loyalty Gap column showing each group's points above or below the first row.
Limits worth knowing
- Loyalty is counted after the rest of the page loads, so the card shows Calculating… for a moment.
- On a very large survey the count stops after a time limit. The note under the card then says that loyalty covers part of the survey's submissions.
- If too few respondents could see the questions in your selection, the card says loyalty needs at least the minimum number of respondents. Widen your filters.
Act on it
- 1Start with the first driver on the list. It holds back the most people who are otherwise fully positive.
- 2Read the questions behind it. Open the answer distribution by question to see which question in that driver drew the lower answers.
- 3Check where it's concentrated. Use the group table to see which teams or locations have the lowest loyalty.
- 4Turn it into a plan. Create an action for that driver and track it to the next survey.
Your feedback helps us improve the Help Center.