

Compare groups with Scores by Group on the Insights tab
How to read the Scores by Group table on the Insights tab: one row per business unit, location, team, sub team or manager, the engagement, favourable, unfavourable and answer split columns, loyalty and loyalty gap, shading against the first row, and why some groups are left out.
On this page
The Scores by Group table at the bottom of the Insights tab puts every group side by side. Pick a grouping, such as Location, and each location gets a row with its engagement, favourable and unfavourable shares, shaded against the whole organization so the strongest and weakest stand out.
Pick a tab (Business Unit, Location, Team, Sub Team or Manager). The first row is the baseline: the whole organization, everyone in your selection, or a Sub Admin's access. Every other row is shaded against it, green for better and terracotta for worse. With the loyalty score on, the table is titled Loyalty and Score by Group and adds Loyalty and Loyalty Gap columns. Groups below the anonymity minimum are not listed.
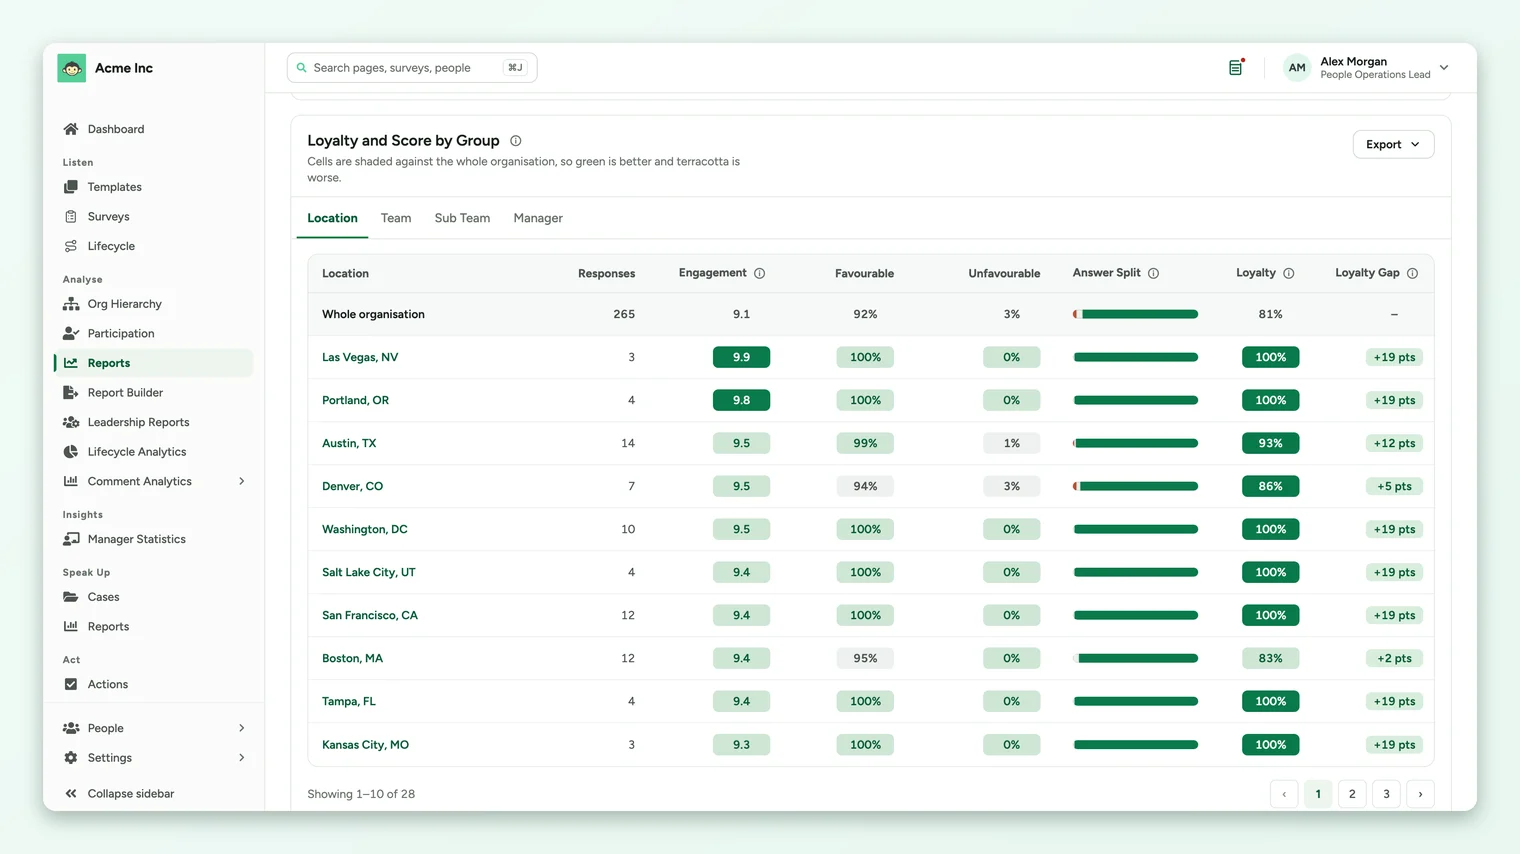
Pick a grouping
The tabs above the table follow the groupings your survey has: Business Unit, Location, Team, Sub Team and Manager, plus Business Group on accounts that use business groups. A tab only appears when at least one group in it has enough responses. Ten groups show per page, with page controls under the table.
The columns
| Column | What it shows |
|---|---|
| Responses | How many responses the group's figures are based on. |
| Engagement | The average of the group's rating answers, on your account's scale. |
| Favourable | The share of the group's answers in the favourable band. |
| Unfavourable | The share of the group's answers in the unfavourable band. |
| Answer Split | A small bar of unfavourable, neutral and favourable answers, left to right. |
| Loyalty | With the loyalty score on: the share of the group's respondents who gave a top-band answer to every rating question. |
| Loyalty Gap | With the loyalty score on: the group's loyalty in points above or below the first row. |
How the shading works
The first row is never shaded. It's the baseline, and every other row is compared with it:
- Green means the group does better than the first row on that column. For Unfavourable, that means a smaller unfavourable share.
- Terracotta means the group does worse.
- Grey means it's about the same.
- Deeper shading means a bigger gap.
The first row changes with your filters. With no filters it's the whole organization. With filters it's Everyone in this selection, so the table compares, say, the teams inside one location with that location as a whole. For a Sub Admin it's Everyone in your access.
Why some groups aren't listed
- Groups with fewer responses than the survey's minimum are left out entirely, to protect the people in them.
- People with no value for the grouping, for example no location in their employee record, aren't listed as a group of their own.
- If no group in any tab has enough responses, the card says No group has enough responses to show. Clear a filter to widen the group.
A group of 3 or 4 people can show 100% favourable or a large loyalty gap that a single answer would change. Read the Responses column before acting on a big difference.
Use the table
- 1Start on the grouping you act on. If you run programs by location, start on Location.
- 2Scan for terracotta in the Engagement and Favourable columns, and for rows with a high Unfavourable share.
- 3Narrow down. Filter the page to a weak location, then switch to the Team tab to see which teams inside it are lowest.
- 4Compare managers in depth with Manager Statistics, which ranks managers and opens a scorecard for each.
Export the table
The card's Export menu offers the current tab as a CSV file, every group table as one CSV file, and an image of the table. See Export from the Insights tab.
Your feedback helps us improve the Help Center.