

Read the headline numbers on the Insights tab
What the engagement score, favourable score, response rate and loyalty score cards on the Insights tab measure, how favourable, neutral and unfavourable are defined on each rating scale, and how to read the change against a compared survey.
On this page
The top of the Insights tab is a row of headline cards. Together they tell you how positive people were, how many took part, and, when you compare surveys, what moved. Every card follows the filters at the top of the page.
Engagement score is the average of every rating answer. Favourable score is the share of rating answers in the top band of your scale (8 to 10 on the default 10-point scale). Response rate is people who submitted out of people invited. Loyalty score, on accounts that have it, is the share of respondents who gave a top-band answer to every rating question. With a survey picked under Compare with, each card shows the change next to it.
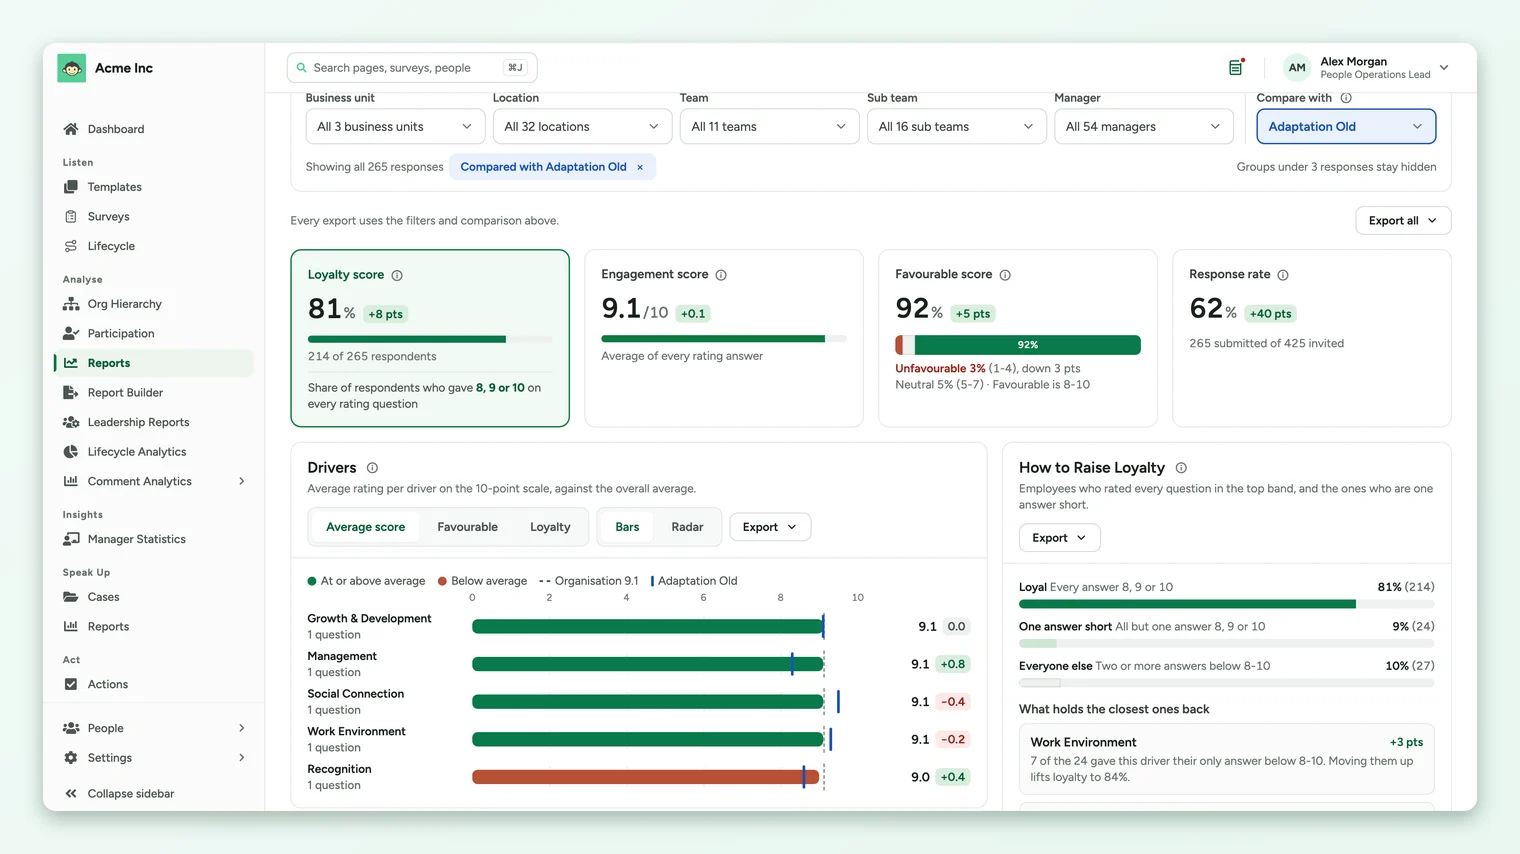
The four cards
| Card | What it measures | How to read it |
|---|---|---|
| Engagement score | The average of every rating answer under your filters, on your account's scale (for example out of 10). | Your overall level. Read it with the favourable share, which shows how widely positive people are. |
| Favourable score | The share of all rating answers that fall in the favourable band. The bar under it splits answers into unfavourable, neutral and favourable. | How widely positive people are. Read it alongside the unfavourable share, which is printed under the bar. |
| Response rate | People who submitted the survey out of the people invited to it, under your filters. The counts are printed under the rate. | How far you can trust the other cards. A low rate in a group means its results speak for fewer people. |
| Loyalty score | The share of respondents who gave a top-band answer to every rating question they answered. Shown only on accounts with the loyalty score on. | The strictest of the four: one lower answer and a respondent isn't counted. See the loyalty score guide. |
Favourable, neutral and unfavourable
Every rating answer is put in one of three bands, using your account's scale. The same bands are used on the favourable card, the drivers chart, the answer distribution and the group table, so a favourable share means the same thing everywhere on the page.
| Your account's scale | Unfavourable | Neutral | Favourable (the top band) |
|---|---|---|---|
| 1 to 10 (the default) | 1 to 4 | 5 to 7 | 8, 9 or 10 |
| 1 to 5 | 1 or 2 | 3 | 4 or 5 |
| Percentage | 1% to 49% | 50% to 79% | 80% to 100% |
An average of 7 can come from most people answering 7, or from a split between 10s and 4s. The favourable and unfavourable shares show which: a polarized result has high shares at both ends. When the average looks fine but the unfavourable share is rising, look at the answer distribution to find where.
Compare with a previous survey
Pick a survey under Compare with in the filter bar. Each card then shows its change next to the number:
- Engagement score shows the change in score, for example +0.1.
- Favourable score, response rate and loyalty score show the change in percentage points, for example +5 pts.
- The unfavourable share reads in words, for example down 3 pts, because a fall in unfavourable answers is good news.
Changes are worked out under the same filters in both surveys. If the compared survey doesn't have enough responses under those filters, no change is shown.
When a card shows a dash
- Response rate shows a dash with Response rate couldn't be calculated: the invitation count couldn't be read for this selection. Refresh the page, and if it persists, contact support.
- Response rate shows Nobody invited under these filters: your filters point at a group with no invitations for this survey.
- Loyalty shows Calculating…: the loyalty count runs after the rest of the page. Wait a few seconds.
Where to go next
- Find the drivers behind the score: Compare drivers on the Insights tab
- Find the groups behind it: Compare groups with Scores by Group
- Look closer at participation: View the participation report
Your feedback helps us improve the Help Center.