

What is CultureMonkey?
A complete orientation to the platform - what CultureMonkey does, who it's for, how the Listen→Analyse→Act loop works, a tour of every module, and where to start.
On this page
- What CultureMonkey is - and who it's for
- The Listen → Analyse → Act loop
- Listen: collecting honest feedback
- Analyse: understanding what it means
- Act: doing something about it
- Speak Up and Integrations
- Roles: who sees what
- Built on trust: anonymity and confidentiality
- What a program looks like end to end
- Typical outcomes and use cases
- Getting-started paths
- Frequently asked questions
- Where to go next
CultureMonkey is an employee experience and engagement platform. It helps you hear honestly from your people, understand what that feedback is really telling you, and turn that understanding into action that measurably improves the workplace - all while keeping employee responses safe and anonymous.
This guide is your orientation. It explains what CultureMonkey is and who it's for, walks through the simple loop that everything is built around, tours each module you'll find in the product, and points you to the right starting path for your role. If you read one article before you do anything else, read this one.
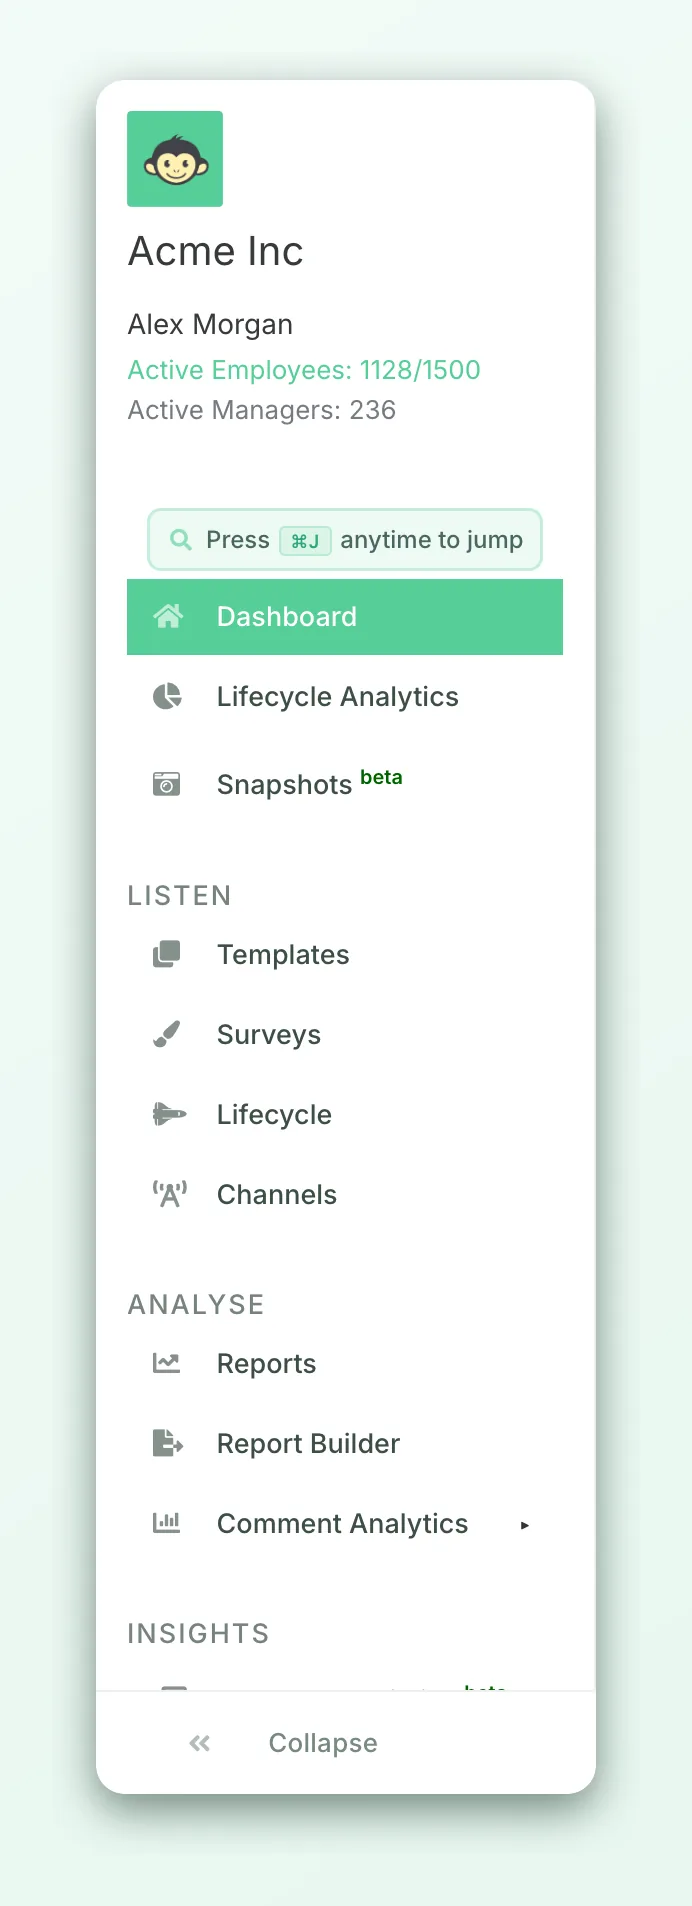
Everything in CultureMonkey follows one loop: Listen (run surveys), Analyse (read the results), Act (do something about them). The main menu is organized around exactly those three stages, plus a Dashboard, Speak Up, and the admin settings that support them. Your view adapts to your role, and results stay anonymous until enough people respond.
What CultureMonkey is - and who it's for
At its core, CultureMonkey is a way to run a continuous conversation with your workforce. Instead of a once-a-year survey that lands in a spreadsheet and is forgotten, it gives you a running program: regular listening, clear analysis, and tracked follow-through. The point isn't to collect data - it's to change the employee experience for the better, and to prove that the change worked.
It's built for the people who own that outcome:
- HR and People teams who run the engagement program end to end - designing surveys, reading results, and coordinating action.
- Leaders and executives who want a trustworthy, trending read on how the organization feels and where to focus.
- People managers who need to see their own team's results and act on them without wading through the whole company's data.
- Every employee, who receives surveys, shares candid feedback, and is protected by anonymity throughout.
You don't need to be an analyst to get value from it. The platform does the heavy lifting - scoring, benchmarking, sentiment analysis, theme clustering - so that a busy HR partner or a first-time manager can open a report and immediately understand what's going on and what to do next.
The Listen → Analyse → Act loop
The most important idea in the whole product is a loop with three stages. Learn these three and you've learned the shape of everything else.
Listen (surveys) → Analyse (reports & feedback) → Act (action plans) → and back to Listen again. It's a cycle, not a one-off. Each turn of the loop should make the next survey's results a little better.
Listen is where you collect honest feedback. You design and send surveys - from quick pulses to deep annual engagement studies - and CultureMonkey delivers them to people over the channels they actually use.
Analyse is where raw responses become understanding. As answers arrive, they're turned into an overall engagement score, an eNPS, driver breakdowns, heatmaps, benchmarks, and trends over time. Open-text comments are analysed for sentiment and grouped into themes, so thousands of comments collapse into a handful of clear takeaways.
Act is where insight becomes change. You turn findings into concrete action plans, assign owners and deadlines, and track them to completion - so employees can see that their feedback led somewhere. That visible follow-through is what makes the next round of listening more honest and more generous.
The loop matters because each stage is weak on its own. Surveys without analysis are just data. Analysis without action is just a report nobody trusts. And action without fresh listening is a guess. Run the whole loop and the parts reinforce each other.
Listen: collecting honest feedback
The LISTEN section of the menu is your survey toolkit. It has five entries, each for a different listening need.
Templates
Under Templates you'll find a library of ready-made, research-backed surveys organized into categories, so you don't have to start from a blank page. You can preview a template, select it, and launch - or use it as a starting point and customize the questions. You can also save your own reusable custom templates. It's the fastest way to get a well-designed survey out the door.
Surveys
Surveys is the full survey builder - where you create a study from scratch and control every detail. Building a survey follows a clear wizard: set the survey's basic details (title, description), add your questions and organize them into sections, choose your audience (which employees receive it), and configure settings like notifications and reminders before you publish. A survey moves through a simple lifecycle - draft, published/running, then ended - and you can automate reminders to nudge non-responders while it's live. See Create a survey from scratch for the step-by-step.
Pulse
Pulse surveys are lightweight, recurring check-ins that keep a finger on the pulse between your bigger surveys. Rather than one long questionnaire, a pulse sends a small, rotating set of questions on a schedule - you can run them daily, weekly, bi-monthly, or monthly - and toggle them on or off as needed. Pulses are ideal for catching momentum and mood shifts early, without causing survey fatigue.
Lifecycle
Lifecycle surveys (sometimes called autopilot surveys) fire automatically at key moments in an employee's journey - think onboarding, exit, and milestone points. You set them up once, and CultureMonkey sends the right survey to the right person at the right time based on their dates, with no manual effort per employee. This is how you capture the always-on feedback that a periodic engagement survey misses.
Channels
Channels is where you connect the delivery methods that carry your surveys to employees. CultureMonkey can reach people over Email, SMS, WhatsApp, Slack, and Microsoft Teams. Meeting people where they already are - a frontline worker on WhatsApp, a desk worker in Slack - is one of the biggest levers for response rates, which is why multiple channels matter.
SMS, WhatsApp, Slack, and Teams each need to be enabled and connected for your account; Email always works out of the box. If a channel isn't showing for you, it likely just needs to be switched on or integrated first.
Analyse: understanding what it means
The ANALYSE section turns responses into insight. Here's what each entry does.
Dashboard
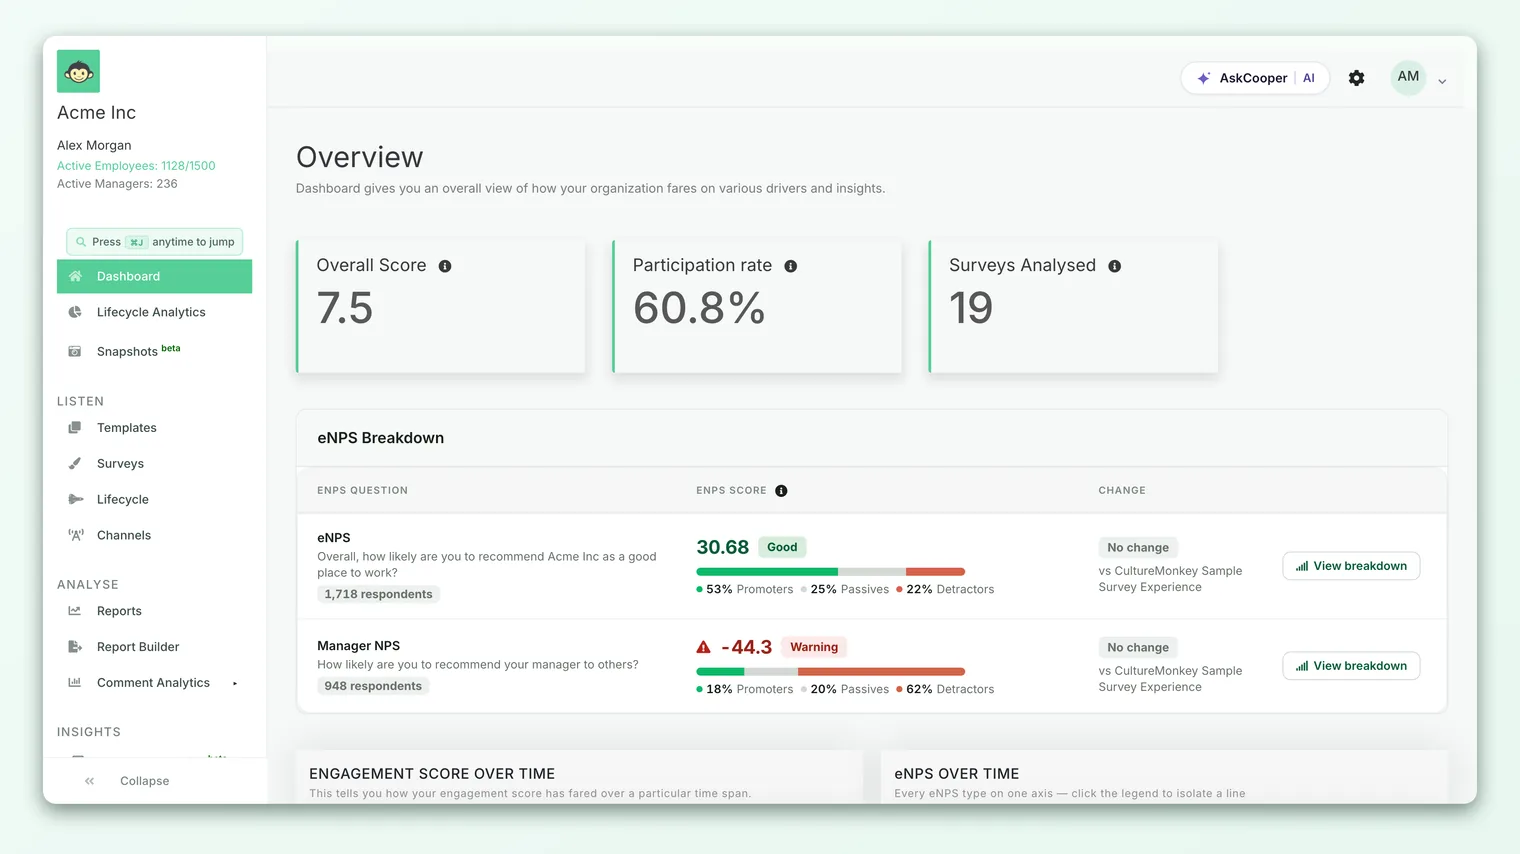
Your Dashboard is the top-level, at-a-glance view of engagement across the organization. It surfaces the headline metrics - your overall engagement score, participation rate, and eNPS, each with the change since your last survey - plus trend charts (engagement over time, eNPS over time), a heatmap of engagement scores by driver across segments, and how you compare to industry benchmarks. It's the first place leaders should look.
Reports
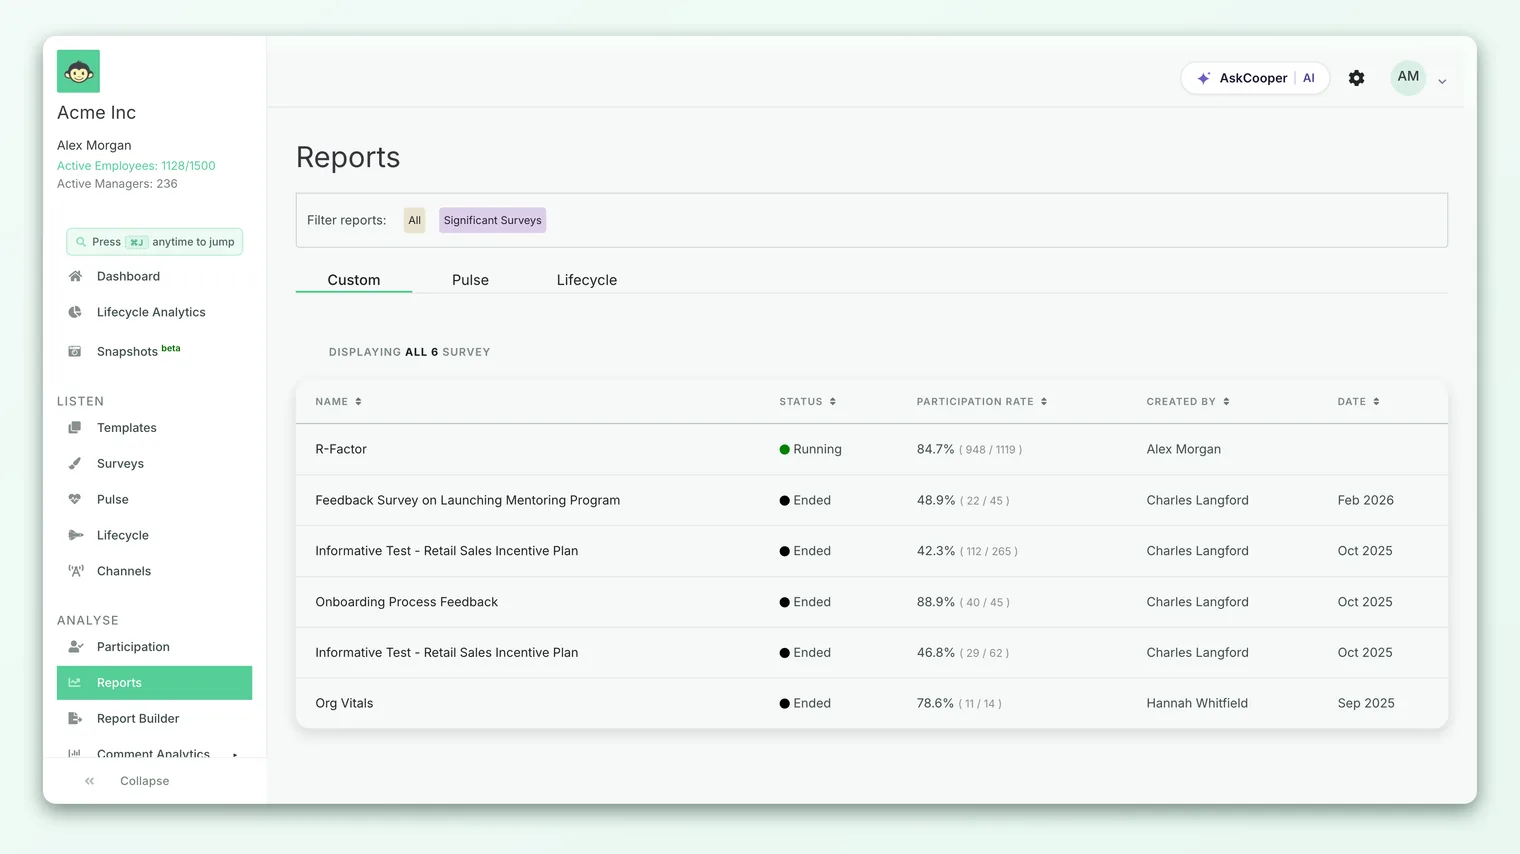
Reports is where you go deep on an individual survey. Beyond the summary, a survey report lets you explore driver performance as a heatmap, drill into individual questions and their comments, view a word cloud of responses, read text feedback, and compare your results against benchmarks - including an eNPS benchmark. Crucially, you can filter and segment every view by demographics like team, location, manager, tenure, business unit, and your own custom attributes, so a company-wide average never hides a struggling team.
Report Builder
Report Builder lets you assemble and export tailored reports from pre-built components - driver reports, demographic breakdowns, heatmaps, and benchmark comparisons - organized so you can generate a consistent read-out survey after survey. It's the tool for producing the deck you share with leadership.
eNPS
eNPS - Employee Net Promoter Score - is one of your headline numbers, shown on both the Dashboard and inside survey reports. It's calculated by sorting respondents into Promoters (rated 9-10), Passives (7-8), and Detractors (0-6), then subtracting the percentage of detractors from the percentage of promoters, giving a score from −100 to +100. It's a fast, comparable read on whether people would recommend you as a place to work. For the full explanation, see What is eNPS?.
Drivers
Drivers are the underlying dimensions of engagement that your questions map to - for example Leadership, Recognition, Growth & Development, Work Life Balance, Communication, Wellness, and Purpose Alignment, among others. Where eNPS and the overall score tell you how people feel, drivers begin to tell you why. Each driver has its own score, trend, segment breakdown, and the comments tagged to it - so you can pinpoint exactly which part of the experience needs attention.
Feedback & comment analytics
The Feedback area (labelled in some accounts as Comment Analytics) is where open-text responses become usable. Every comment is automatically scored for sentiment - positive, neutral, or negative - and grouped into themes and topics using AI, so instead of reading thousands of comments one by one, you get a clear map of what people are talking about and how they feel about it. You can filter comments by sentiment, driver, and demographic, explore topics, and adjust tags where needed. This is how you find the specific, quotable reasons behind the numbers.
Participation
Participation tracks who has and hasn't responded while a survey is live. It shows your overall response rate, breaks it down by demographic (manager, team, location, and more), plots participation over time, and flags gaps - like employees missing an email or manager. It's your operational tool for driving response rates before a survey closes.
Act: doing something about it
Insight only matters if it drives change, which is what the ACT section is for.
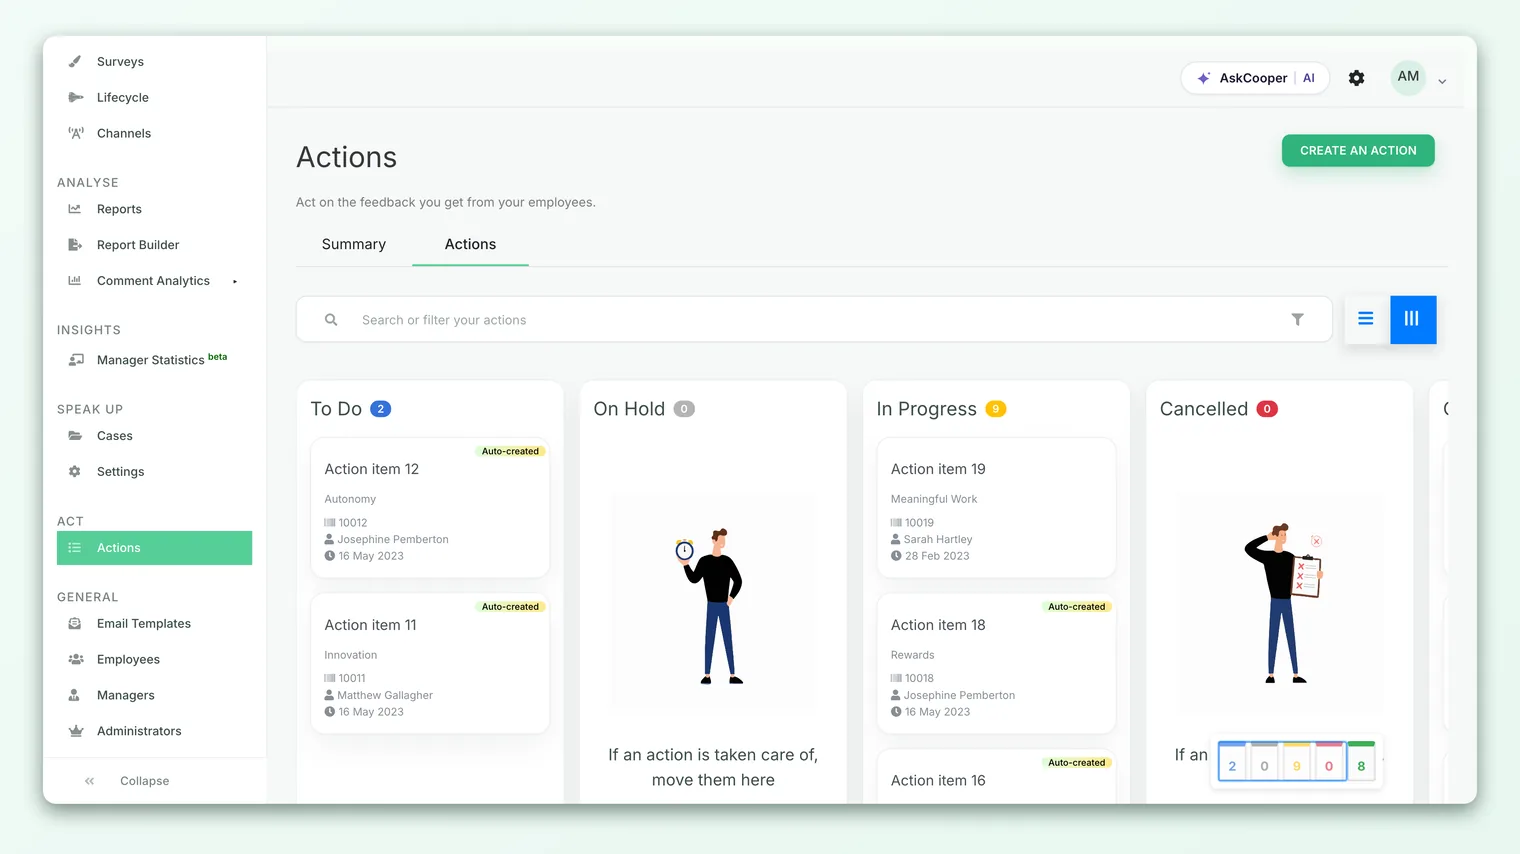
Actions is a task board for turning findings into follow-through. You create an action plan - often directly from a piece of feedback, a low-scoring driver, or a specific question - then assign an owner, add collaborators, set a deadline, and move it across a Kanban board of statuses: To do → In progress → Completed, with On hold and Cancelled available too. Each action links back to the driver or comment that prompted it, so there's a clear line from "what employees said" to "what we did about it."
Employees who see their feedback lead to real change are far more likely to trust the next survey and answer it honestly. "You spoke, we acted" is the most reliable way to keep your listening program healthy - and Actions is how you make that visible.
Speak Up and Integrations
Two more capabilities sit alongside the core loop.
Speak Up is a dedicated, confidential channel for raising concerns - the kind of sensitive issue that doesn't fit in a survey. An employee (a reporter) can submit a case either anonymously or identified, and a case team moves it through a structured lifecycle - new → triage → investigation → concluding → closed - with a two-way message thread that preserves the reporter's anonymity throughout, plus acknowledgement and response timelines. It gives people a safe, trackable way to speak up, and gives the organization an auditable way to respond.
Integrations connect CultureMonkey to the systems your people data already lives in. HRIS integrations - including Workday, BambooHR, Darwinbox, Zoho People, Keka, and others - keep your employee list and attributes in sync automatically, so surveys always reach the right people with the right demographics attached. Communication integrations power the Slack and Microsoft Teams channels, and SSO/SAML enables single sign-on for secure access. Good integrations mean less manual upkeep and cleaner segmentation.
Roles: who sees what
CultureMonkey tailors both the menu and the data to who you are. The same product looks different depending on your role, because people should only see what's relevant - and permitted - for them.
| Role | Broadly, what they do | What they typically see |
|---|---|---|
| Account admin (super admin) | Owns the whole account - people, integrations, settings, permissions | Everything, across the full organization |
| Survey admin (sub admin) | Builds, launches, and manages surveys and reports | Their assigned surveys and the segments they're scoped to |
| Manager | Sees their own team's results and acts on them | Filtered reports for their direct and indirect reportees |
| Employee | Receives surveys and shares feedback | Their own surveys - never anyone else's results |
There's also a read-only report viewer role for people who need to see results but not change anything.
The menu and the data adapt to who you are and how your account is configured. If something described in our guides isn't in your account, it's most likely switched off for your role or plan - not broken. When in doubt, check with your account admin.
Built on trust: anonymity and confidentiality
Honest feedback only happens when people feel safe, so trust is engineered into the platform rather than promised on top of it.
The key mechanism is an anonymity threshold: results for any group are only shown once enough people have responded. By default that threshold is five responses (an account admin can adjust it, but not below three). If you filter down to a team or segment smaller than the threshold, its results stay hidden - because with too few responses, an individual's answers could be inferred. This applies across dashboards and reports, and there are additional safeguards that mask demographic detail in exports of open-text comments.
This is why you'll sometimes open a breakdown and see it withheld. That's the protection working as intended, not an error - and it's exactly what lets employees answer candidly. If a view looks empty, see Why can't I see results yet?.
What a program looks like end to end
Putting it together, a healthy engagement program running on CultureMonkey looks like a repeating cycle:
- 1Set up the foundation. Get your people and their attributes in (often via an HRIS integration), configure roles, and connect the channels you'll use to reach employees.
- 2Listen. Launch a survey - from a template or built from scratch - to the right audience, and keep an eye on Participation to drive a strong response rate.
- 3Analyse. Once results clear the anonymity threshold, read the Dashboard for the headline, then dig into Reports, drivers, and Feedback to understand the why behind the numbers.
- 4Act. Turn the biggest findings into Actions with owners and deadlines, and work them to completion on the board.
- 5Close the loop. Tell employees what you heard and what you're doing about it. Visibly acting on feedback is itself one of the strongest ways to build trust.
- 6Repeat. Run a pulse or your next survey and watch the trend. Improvement compounds over cycles - the loop is the product.
Typical outcomes and use cases
Teams reach for CultureMonkey to do things like:
- Run a company-wide annual or bi-annual engagement survey and track the trend, not just the snapshot.
- Keep a continuous pulse on morale between big surveys, catching issues while they're still small.
- Automate onboarding and exit feedback so no critical moment goes unmeasured.
- Give managers ownership of their own team's results and a clear, trackable way to act on them.
- Diagnose a specific problem - say, a dip in a location's eNPS - by slicing scores by segment and reading the comments behind them.
- Prove impact to leadership with benchmarked, trending numbers and a visible record of the actions taken.
Getting-started paths
Where you go first depends on your role:
- If you're an account admin setting things up: start by getting your people and integrations in place, then read Navigating CultureMonkey to learn the layout.
- If you're ready to run your first survey: follow Create a survey from scratch, or start from a template for the fastest path.
- If you're a manager who just got access: open your Dashboard, then explore your team's Reports - filtered results and drivers are the fastest way to know where to focus.
- If you want to understand the metrics first: begin with What is eNPS? and the overall engagement score.
Frequently asked questions
Do I need to learn every module to use CultureMonkey?
No. Learn the loop - Listen, Analyse, Act - and you can be productive with just the parts your role needs. A manager might live entirely in the Dashboard and Reports; an admin will range wider. The menu is organized around the loop precisely so you always know where you are.
Can employees see other people's answers?
Never. Employees only ever see the surveys sent to them. Results are visible to admins and managers within their scope, and always subject to the anonymity threshold, so no individual's responses can be identified.
How is my feedback kept anonymous?
CultureMonkey aggregates individual responses, and a group's results are only shown once enough people have answered - five by default. Below that threshold, results are withheld so no one can be singled out. Open-text comment exports carry additional safeguards to mask demographic detail.
What's the difference between a survey, a pulse, and a lifecycle survey?
A survey is a study you design and send to a chosen audience at a point in time. A pulse is a light, recurring check-in on a schedule (daily through monthly). A lifecycle survey fires automatically at a moment in an employee's journey - like onboarding or exit - without per-person effort.
Where do I see my engagement score and eNPS?
Both appear on the CultureMonkey Dashboard for an at-a-glance view, and inside individual survey Reports for the detail. From there you can trend them over time and break them down by segment.
What is Speak Up, and how is it different from a survey?
A survey gathers broad, structured feedback from many people. Speak Up is a confidential, one-to-one channel for raising a specific concern - with the option to stay anonymous - and it's tracked as a case through investigation to resolution. Use surveys to measure the culture; use Speak Up to handle individual issues safely.
Where to go next
- New to the layout? Read Navigating CultureMonkey for a tour of the menus.
- Ready to run a survey? Follow Create a survey from scratch.
- Want to understand the metrics? Start with What is eNPS?.
- Hiring, before day one: What is Candidate Experience in CultureMonkey?
Your feedback helps us improve the Help Center.