

Use the Lineage Explorer to compare managers
How to open the Lineage Explorer from the org chart, switch between Direct and Total, move up and down a reporting line, read the heat grid of participation, overall, eNPS and driver scores, drill into a driver, and export the grid to XLSX.
On this page
The Lineage Explorer compares the managers who report to one leader, side by side, in a single heat grid. Each row is a manager; the columns are participation, the overall score, eNPS and each driver. Use it to see which part of a leader's organization is doing well and which needs attention, then click any cell to see the questions behind the score.
Related release: Updates on Org Hierarchy: trace a driver score to its questions, and see eNPS by manager (August 27, 2026). See every dated change on Product Updates.
Open a manager on the org chart and click Open lineage explorer. The grid shows that manager IN FOCUS, then one row group for each manager who reports to them directly, with Direct and Total scores. Click a manager's chevron to go one level down, or a breadcrumb to go back up. Click a heat cell for the driver's questions and the org benchmark. Export XLSX downloads the grid with the same anonymity rules as the screen.
What the Lineage Explorer is
The org chart shows you one manager at a time. The Lineage Explorer shows a leader and their direct-report managers together, so you can compare peers who answer to the same person. Because everyone in the grid sits at the same level, their numbers are directly comparable.
The grid goes one level deep at a time. To see the managers further down, you open a manager's own lineage, and the grid re-centres on them. Total rows still roll up everyone below each manager.
Who can use it
The Lineage Explorer has the same access as the org chart: Super Admins, plus Sub Admins when Org Hierarchy is switched on for sub admins, limited to the people and surveys in their scope. Managers and employees cannot open it. If you don't see Org Hierarchy in your sidebar, contact your Customer Success Manager or CultureMonkey support.
Open the Lineage Explorer
- 1Open Org Hierarchy from the Analyse group in the sidebar.
- 2Pick a survey in the survey picker, or stay on Current hierarchy. eNPS columns appear only when a survey is selected.
- 3Click a manager's card to open their panel. Use Jump to a manager to find someone quickly.
- 4Click Open lineage explorer. The button shows when that manager's scores can be displayed. If their scores are hidden for anonymity, use Show reports in chart and open one of their reports instead.
To return to the chart, click View Org Chart at the top left. The chart re-opens on the manager you were looking at.
How the page is laid out
- Header: the Lineage Explorer title, the View Org Chart link, the scope control and Export XLSX.
- Filter bar: the same filters as the org chart.
- Breadcrumbs: the reporting line from the top of the org down to the manager in focus. Beside them, the survey you are reading; click it to open that survey's reports in a new tab.
- Focus header: the manager in focus, their role, their number of direct reports and how many people they have in total.
- IN FOCUS row: the focus manager's own scores.
- Direct Reports card, labelled with the number of managers: one row group for each manager who reports directly to the focus manager.
- Footer: a note on individual contributors, the score legend and the hidden for anonymity marker.
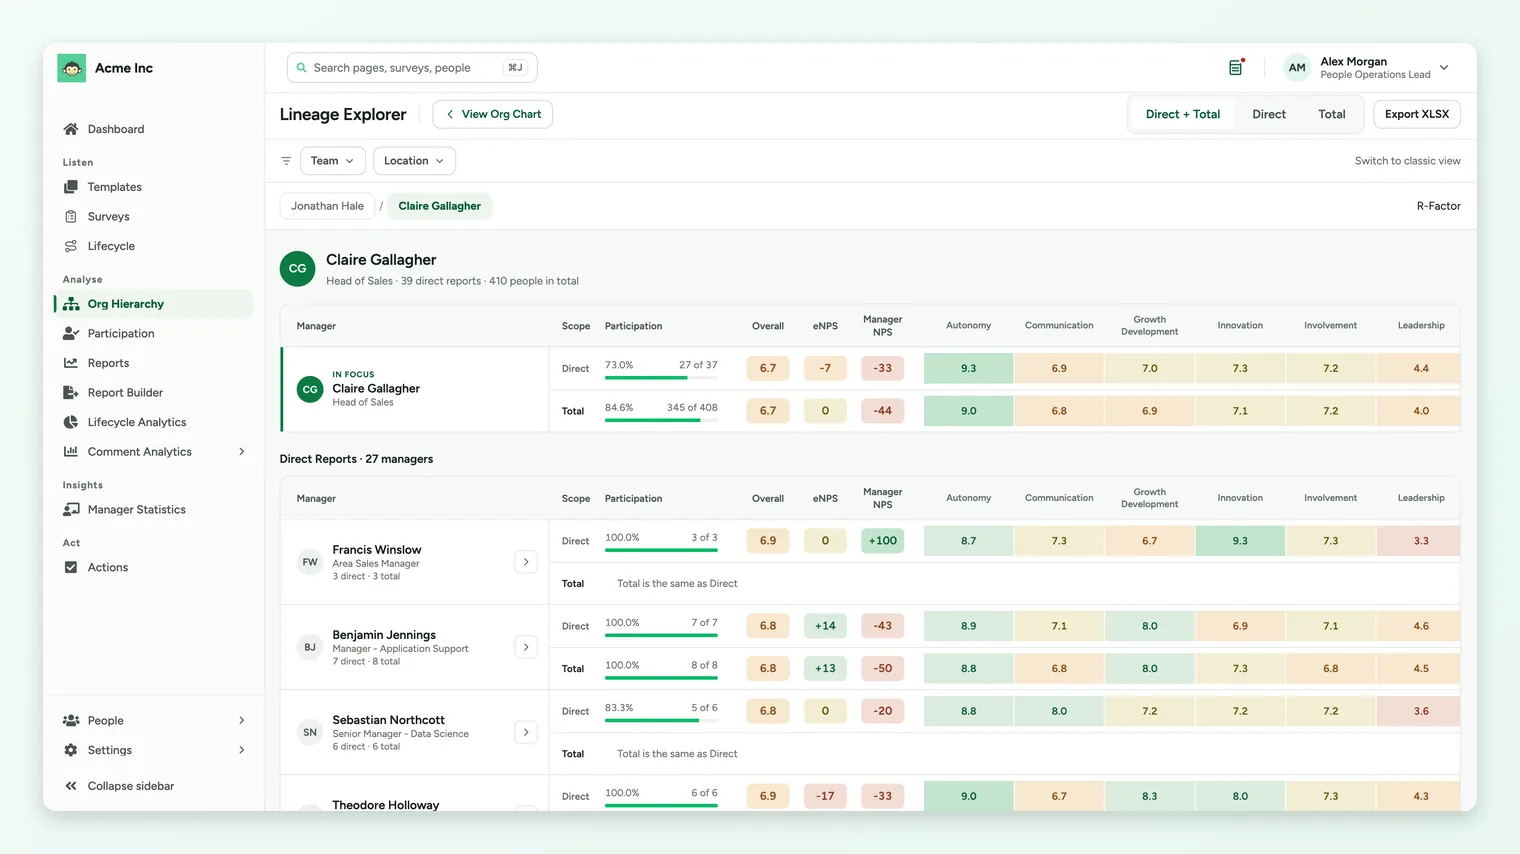
Rows are sorted by their Total overall score, highest first. A manager whose Total score is hidden sorts to the bottom. Each manager's name carries their counts, for example 5 direct · 34 total, so you can see at a glance whether two rows cover populations of a similar size.
Individual contributors who report straight to the focus manager don't get a row. They are counted in the focus manager's Direct population, and the footer says how many there are.
Choose Direct, Total or both
The scope control in the header sets which rows each manager gets:
| Option | What you see |
|---|---|
| Direct + Total | Two rows per manager: Direct, then Total. This is the default. |
| Direct | Only the people who report to each manager. |
| Total | Everyone below each manager at every level, direct reports included. |
When nobody sits below a manager's direct reports, their Total row reads Total is the same as Direct. For more on the two scopes, see Understand the org hierarchy chart.
Move up and down the reporting line
- Go one level down: click the chevron beside a manager's name (Open [name]'s lineage). That manager becomes the one IN FOCUS, and the grid shows the managers who report to them. The chevron appears only for managers who have people below them.
- Go back up: click any name in the breadcrumbs to re-centre the grid on that person. Your browser's Back button also steps back through the managers you have opened.
- Back to the chart: View Org Chart returns you to the canvas, opened on the manager in focus.
Read the heat grid
| Column | What it shows |
|---|---|
| Manager | Name, role and counts, with the chevron to open their lineage. |
| Scope | Whether the row is Direct or Total. |
| Participation | The participation rate, the number of respondents out of participants, and a bar. Low participation is highlighted. |
| Overall | The overall score for that row. |
| eNPS | The row's eNPS, on its own bands. Shown only when a survey is selected. |
| Custom eNPS columns | One column for each custom eNPS question the survey asked. Shown only when a survey is selected. |
| One column per driver | A heat-coloured cell for each driver. Click a cell to drill in. |
The colour legend in the footer is labelled Score. Scores show in your account's scale. A cell with a dash is hidden for anonymity. To learn more about eNPS and custom eNPS questions, see What is eNPS and Custom eNPS-style questions.
Start with the Total column of each row to see which branch is weakest, then compare that manager's Direct row. A low Total with a healthy Direct row points further down the branch: open that manager's lineage to find where.
Drill into a driver
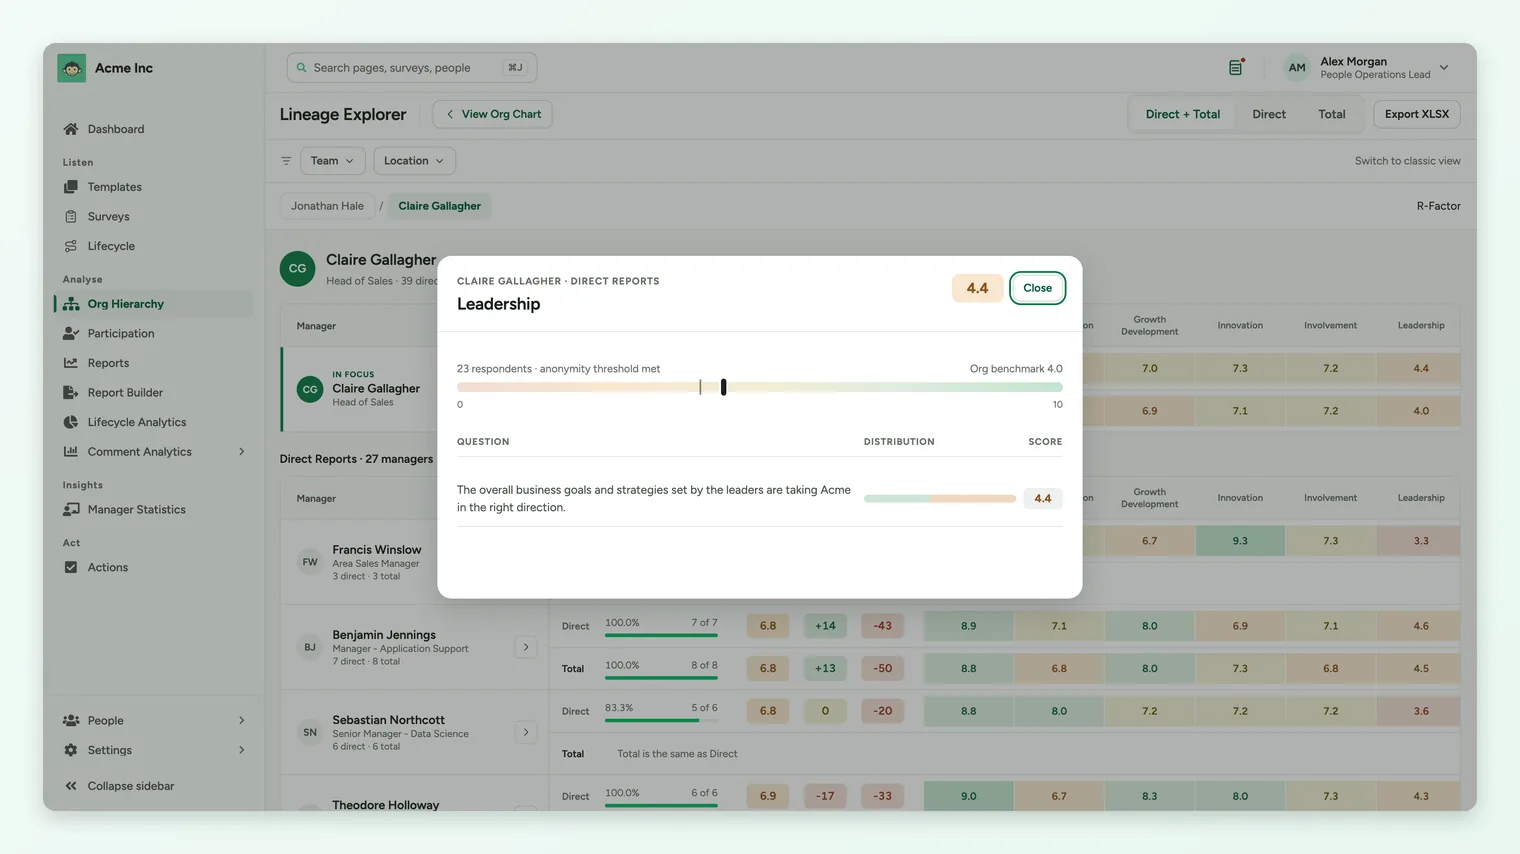
Click any driver cell, or move to it with the keyboard and press Enter, to open the drill-down for that driver, that manager and that row's scope.
- Header: the manager's name with DIRECT REPORTS or TOTAL REPORTS, the driver's name and its score.
- Gauge: where the score sits on a 0 to 10 track, the number of respondents, and Org benchmark with your organization's average on the same questions.
- Questions: every question in the driver, up to 100, with columns QUESTION, DISTRIBUTION (unfavourable, neutral and favourable answers) and SCORE. If a driver has more questions than can be shown, a note says the rest are not listed.
If the driver has no question-level scores for that row, the drill-down says No question-level scores are available for this driver. Click Close to return to the cell you opened it from. For drilling into drivers in survey reports, see Drill down into driver performance.
Filter the grid
The Lineage Explorer uses the same filter bar as the org chart, with Team and Location by default. Filters you set on one screen stay set on the other. Pick values in a filter and click Apply; Clear filters resets them. The filters you apply also carry into the export and back to the chart.
Export to XLSX
Click Export XLSX to download the grid for the manager in focus and the managers who report to them. The file follows the survey and filters you are viewing.
- Same anonymity rules as the screen. The file is built on the server with the same checks, so an export never shows a score the grid hides.
- Scope. With Direct selected, the file holds Direct rows only. With Direct + Total or Total, it holds both Direct and Total rows.
- Columns: Overall, then each driver, then eNPS and any custom eNPS columns when a survey is selected.
- File name: your account, the word lineage, the survey (or current) and a timestamp.
Hidden scores and empty states
Anonymity works the same way as in the org chart. Scores need the survey's minimum number of responses (the current hierarchy uses your dashboard threshold), and Direct and Total are checked separately, driver by driver. eNPS is checked on its own response count. Names and headcounts always show. See Anonymity thresholds explained.
| What you see | What it means |
|---|---|
| A dash in a cell | That score is hidden for anonymity. |
| Direct scores hidden or Total scores hidden, with the response minimum | The whole row is below the threshold. Hover over it for the reason. |
| Total is the same as Direct | No one sits below this manager's direct reports. |
| No participation data for this manager | Nobody under this manager has been part of the surveyed population. |
| No managers report to this person | The manager in focus has no managers below them. Use the breadcrumb to move back up the lineage. |
| This manager is not in the visible tree | The manager isn't in the hierarchy for the survey, filters or scope you are viewing. |
| No question-level scores are available for this driver. | The drill-down has no question scores to show for that row. |
Frequently asked questions
Can managers use the Lineage Explorer?
No. It is an admin tool. Managers see their own results on their dashboard, for their direct reports or for everyone below them. See A tour of the manager dashboard.
Can I see every level below a leader in one table?
No. The grid shows one level of managers at a time, so you are always comparing peers. Total rows do roll up everyone below each manager, and you open a manager's lineage to go a level further down.
Why is there no eNPS column?
eNPS needs a survey. Pick one in the survey picker on the org chart, rather than Current hierarchy, and the eNPS column appears, along with a column for each custom eNPS question the survey asked. If eNPS is hidden for your account, the column doesn't appear.
Why don't individual contributors have rows?
The grid compares managers. Individual contributors who report to the manager in focus are counted in that manager's Direct population and are not scored separately. The footer says how many there are.
Does the export include scores hidden on screen?
No. The export applies the same anonymity rules as the grid.
Where to go next
- How the chart is built: Understand the org hierarchy chart
- Results by manager across the product: See engagement, eNPS and participation by manager
- The questions behind a driver: Drill down into driver performance
- Why a row is hidden: Why can't I see results yet?
Your feedback helps us improve the Help Center.