

See engagement, eNPS and participation by manager
How to read each manager's engagement, eNPS and participation in CultureMonkey: the org chart manager panel with Direct and Total scopes, the Lineage Explorer for comparing managers, what managers see on their own dashboard, and who can see what.
On this page
Org Hierarchy shows engagement, eNPS and participation for each manager in your organization, rolled up through your reporting lines. You can read one manager's results from the org chart, compare the managers who report to a leader side by side, and each manager sees their own team's results on their Manager Dashboard.
This guide covers all three views, the Direct and Total scopes they share, who can open each one, and how anonymity applies. For how the hierarchy itself is built from your manager data, see Understanding the org hierarchy.
Every manager's results come in two scopes: Direct (the people who report straight to them) and Total (everyone below them, direct reports included). Admins click a manager in the org chart to see their Overall score, participation and driver scores, and use the Lineage Explorer to compare the managers under a leader. Managers see their own team on the Manager Dashboard and never open the org chart. Each scope is checked against your anonymity threshold on its own.
Direct and Total: the two scopes
Every manager result in Org Hierarchy can be read two ways:
- Direct covers the people who report to the manager. Use it to see how the manager's own team is doing.
- Total covers everyone below the manager at every level, direct reports included. Use it to see the whole part of the org they lead.
Total always includes Direct. For a manager whose direct reports have no reports of their own, the two are the same, and the org chart says so.
See a manager's results in the org chart
The org chart is an admin tool. Open Org Hierarchy from the Analyse group in the sidebar to see the Organization Hierarchy chart.
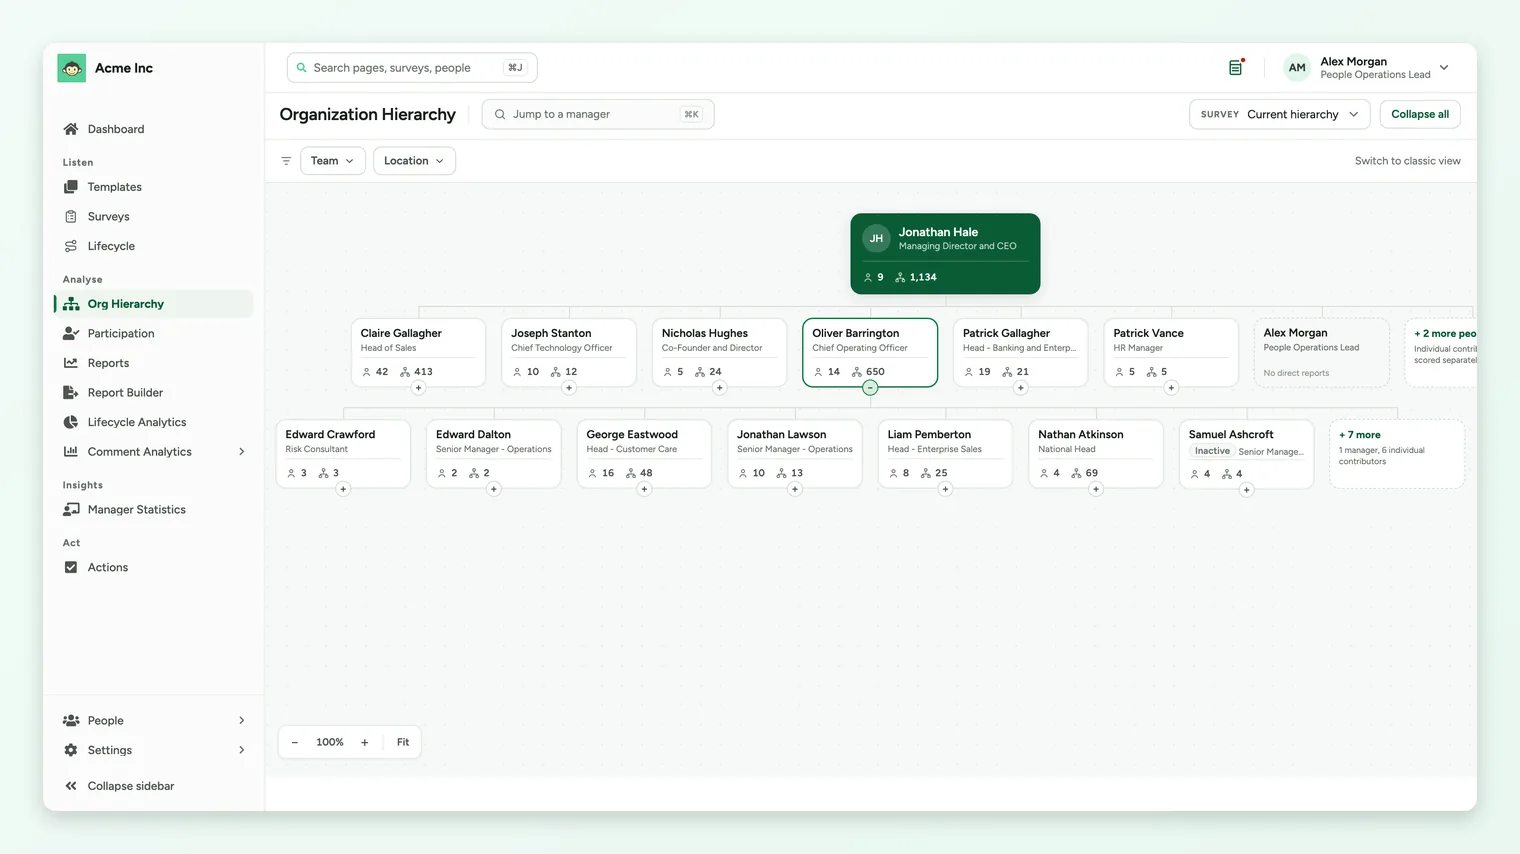
- 1Pick what to look at. Use the survey picker: Current hierarchy shows every survey summed against today's org, and Choose survey lists the surveys that have a hierarchy, newest first.
- 2Find the manager. Expand the chart, or use Jump to a manager to search by name. Each card shows headcounts (Direct reports and Total reports), not scores.
- 3Click the manager's card. A panel opens with the manager's name and a line such as 12 direct · 48 total, and two tabs: Direct and Total.
- 4Switch between the tabs to read the results for each scope.
For the selected scope, the panel shows:
- OVERALL: the manager's overall score, in your account's score scale.
- PARTICIPATION: the participation rate, with how many of the people in scope responded.
- DRIVER SCORES: a score for each driver. A driver that is held back shows as hidden for anonymity.
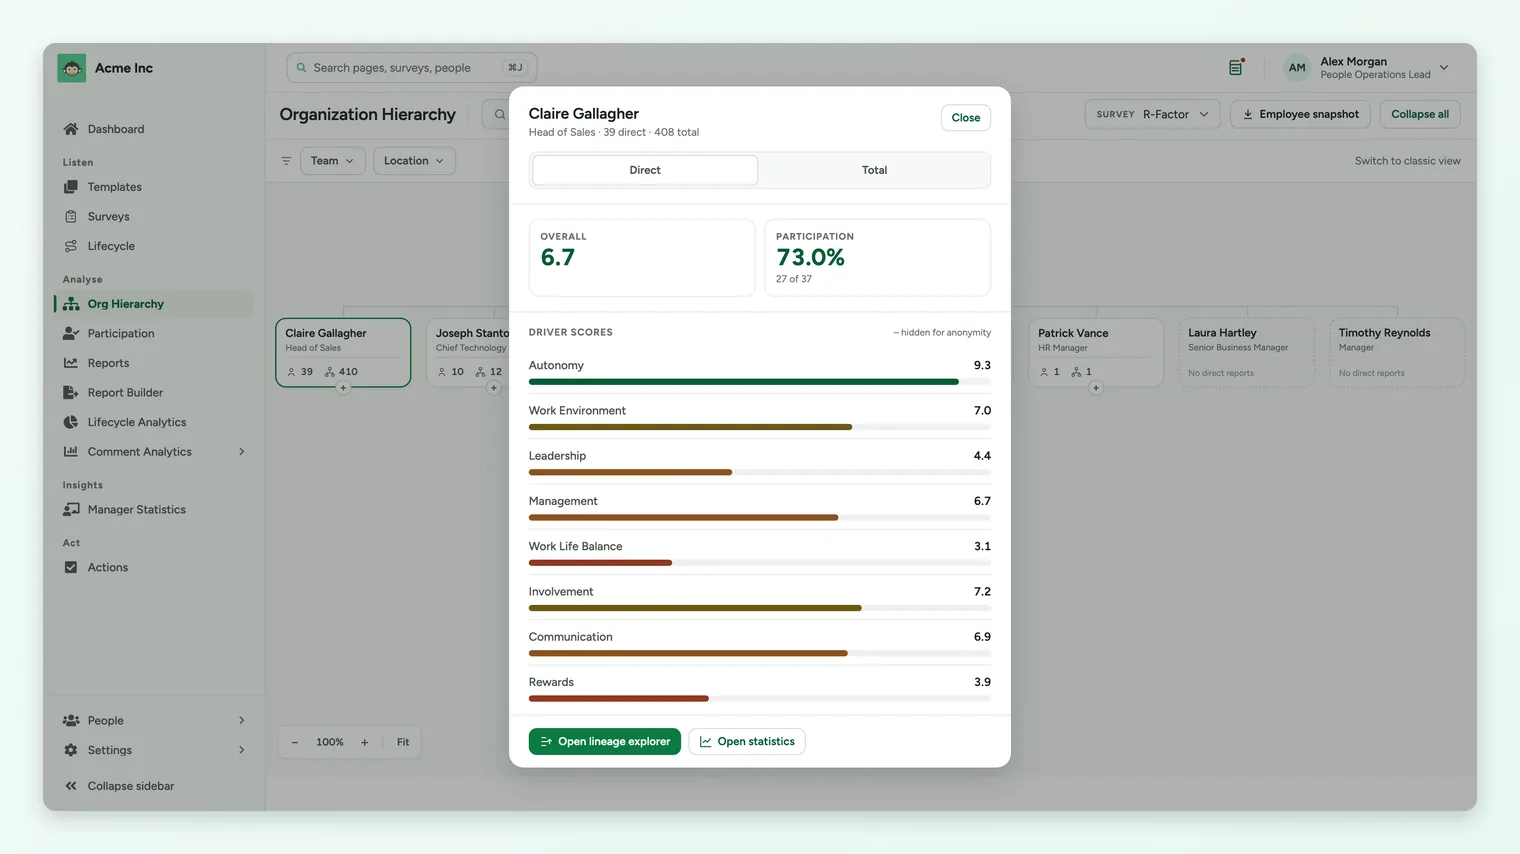
When the manager's direct reports have no reports of their own, the Total tab is unavailable and the panel notes Total is the same as Direct.
When a scope is hidden
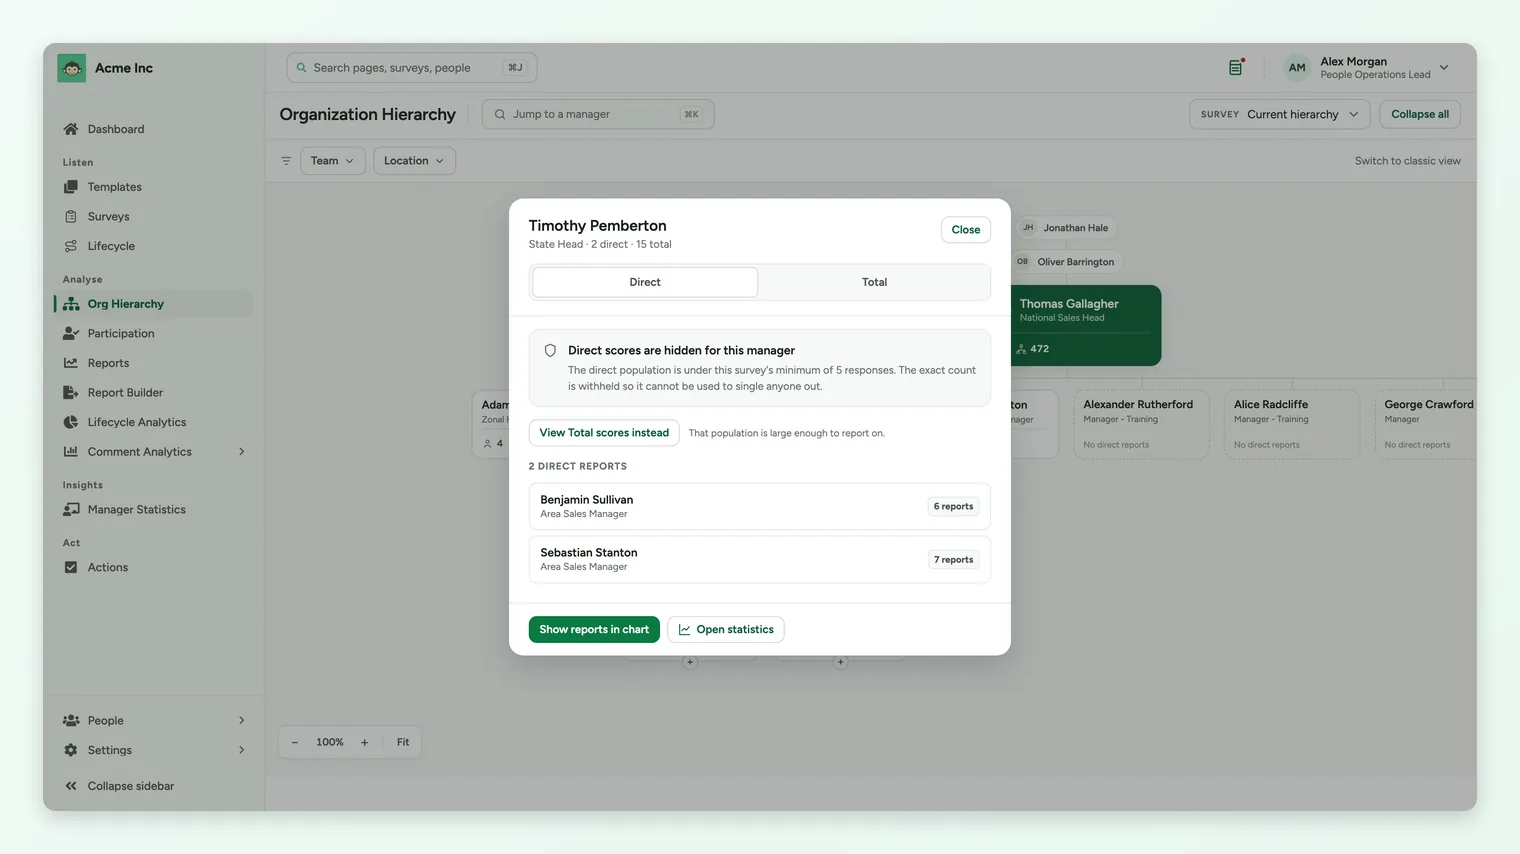
If too few people in a scope responded, the panel holds that scope's scores back. It still lists the manager's direct reports by name. When the other scope is large enough, the panel offers it with a View Total scores instead or View Direct scores instead button, noting that the population is large enough to report on. A small team often reads as hidden on Direct and reportable on Total.
Where to go from the panel
- Open lineage explorer opens the Lineage Explorer focused on this manager.
- Show reports in chart expands this manager's reports on the chart.
- Open statistics opens the manager's Manager Statistics page. It appears only when Manager Statistics is available in your account.
Compare the managers under a leader
To compare managers side by side, use the Lineage Explorer. Pick a leader and it shows one row for each manager who reports to them, with columns for participation, Overall and each driver, colour-coded by score. Choose Direct + Total, Direct or Total to set which population each row reports on.
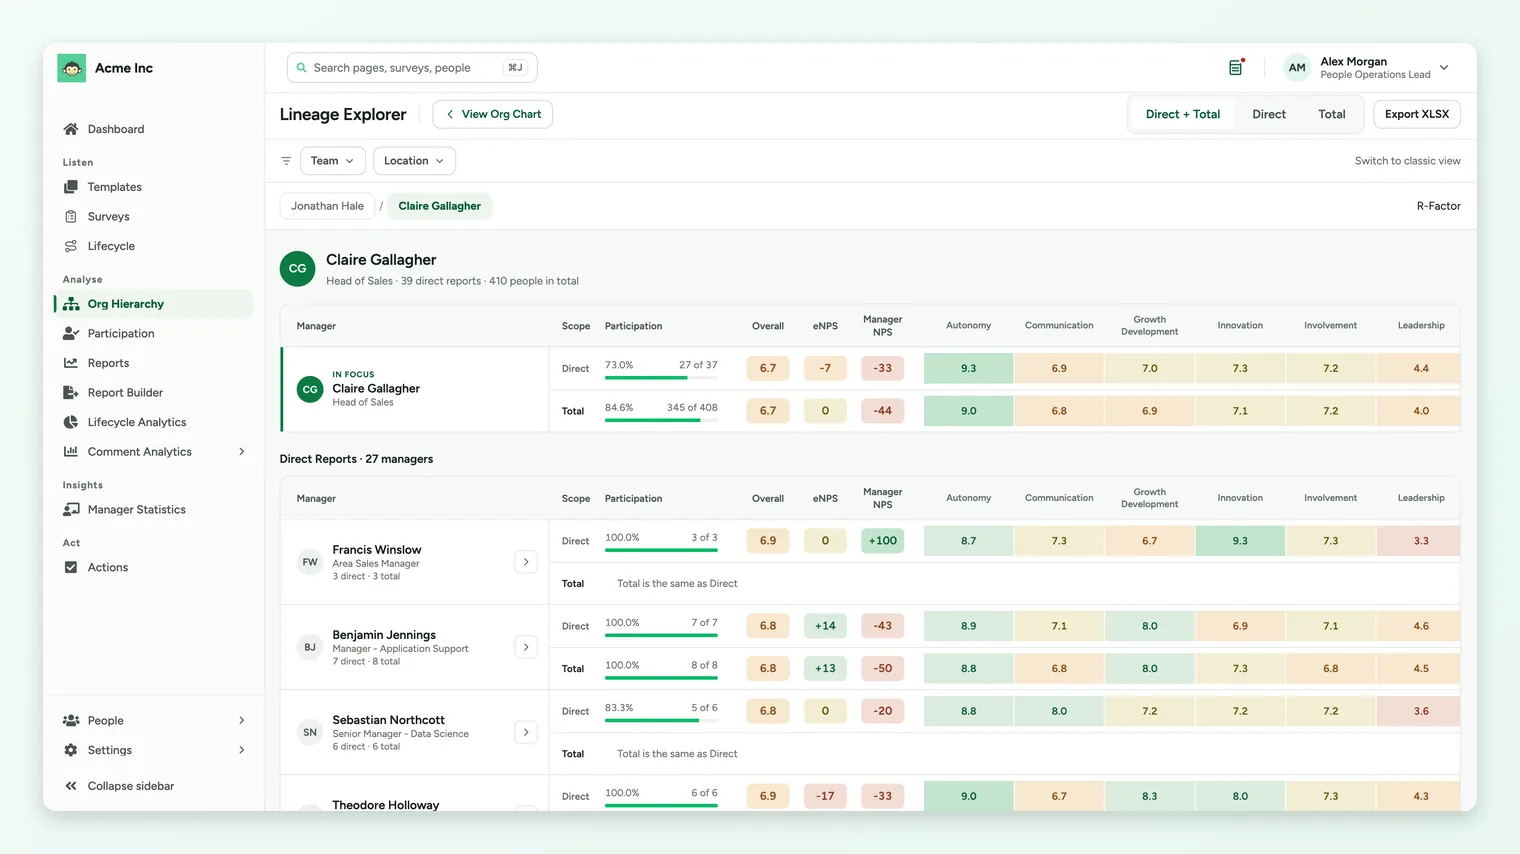
eNPS appears in the Lineage Explorer as its own column, plus one column for each custom eNPS question, when a survey is selected. It does not appear on the Current hierarchy view. You can click a driver score to drill into its questions, and export the grid to XLSX with the same anonymity rules as the screen. The Lineage Explorer guide covers it step by step.
What managers see on their Manager Dashboard
Managers don't open the org chart or the Lineage Explorer. They see their own results on the Manager Dashboard, which covers their full reporting line by default: everyone below them, at every level. For a full tour, see A tour of the manager dashboard.
The Report scope toggle
Managers with at least 3 direct reports see a toggle at the top of the dashboard with two options: Direct reports and Total reports. It switches every number on the dashboard between their direct reports and their entire reporting line, and the same choice applies on the survey report pages they can open. The choice is saved for each manager, so the dashboard opens the way they left it. Managers with fewer than 3 direct reports don't see the toggle.
Strengths and focus areas
Strengths and Focus Areas lists the drivers where the manager's team scores highest and lowest, for the scope they have selected. It follows the same anonymity rules as the rest of the dashboard, including for drivers in survey sections that only some people see. See View your team's strengths and focus areas.
Assigned actions
When actions are shown on the manager dashboard for your account, managers see the actions assigned to them and an Action Summary, so they can follow through on what the results show. To show actions to managers, contact your Customer Success Manager or support. See manager action plans.
Comment Sentiment by Driver
On the Report tab of a survey report, managers see a Comment Sentiment by Driver card. It shows, for each driver, the share of their team's comments that are positive, mixed and negative. It shows percentages only, never comment text, so a manager can see how comments lean without reading them. The card follows the Direct and Total toggle.
- A driver's sentiment appears once at least 5 different people in the group have commented on it, or your survey's minimum responses if that is higher.
- Below that, the driver shows Not enough comments to display.
- The card is for managers. Admins don't see it on their own reports.
- Your account's settings for manager visibility can hide this card. See Control what managers can see.
Before enough people respond
Until enough of a manager's reports have answered, the dashboard shows No results yet for this survey. It says how many of their reports have answered so far and how many responses are needed, and lists what is Hidden until then: the eNPS breakdown, scores by survey, feedback sentiment, strengths and focus areas, and the company and industry comparison. Results appear as soon as the group is large enough. See Why can't I see results yet?
Who sees what
| Role | What they can see |
|---|---|
| Super Admin | The org chart, the manager panel and the Lineage Explorer for every manager. Can also open a manager's dashboard with View As Manager. |
| Sub Admin | The same tools, when Org Hierarchy is opened to sub admins in your account, limited to the surveys and people within their data scope. |
| Manager | Their own team only, on the Manager Dashboard and on the survey reports they have access to. Managers never open the org chart or the Lineage Explorer. |
| Employee | None of these views. |
A sub admin's scope is set by demographics such as team, location or business unit, not by reporting line. Org Hierarchy is switched on by CultureMonkey: to turn it on, or to open it to sub admins, contact your Customer Success Manager or support.
How anonymity applies
Manager results follow the same anonymity rules everywhere they appear:
- Direct and Total are checked separately, driver by driver, against your survey's minimum responses. On the Current hierarchy view, your dashboard anonymity threshold applies.
- Names and headcounts always show. Only scores are held back.
- eNPS is checked on its own response count.
- Exports never show more than the screen. The panel, the Lineage Explorer and its XLSX export apply the same rules.
For the full detail, see Thresholds on Direct and Total results.
Frequently asked questions
Can managers see the org chart?
No. The org chart and the Lineage Explorer are admin tools. Managers see their own team's results on the Manager Dashboard and on the survey reports they have access to.
Why are a manager's Direct scores hidden when Total scores show?
Each scope is checked on its own. A manager with a small direct team may not reach the threshold on Direct, while their whole reporting line does on Total. The panel offers the scope that can be reported on.
Do the org chart cards show scores?
No. Cards show headcounts. Click a card to open the panel with the manager's scores, or use the Lineage Explorer to see scores for several managers at once.
Where do I see eNPS by manager?
In the Lineage Explorer, with a survey selected. Managers see their own team's eNPS on the Manager Dashboard.
Will a reorg change a past survey's results by manager?
No. Each survey keeps the hierarchy as it was at launch. The Current hierarchy view uses today's reporting lines, which rebuild overnight after a manager changes. See Understanding the org hierarchy.
Where to go next
- Compare managers side by side: Lineage Explorer
- How the hierarchy is built: Understanding the org hierarchy
- The manager's view: A tour of the manager dashboard
- Direct and total reports: View your direct and indirect reports
- Anonymity rules: Anonymity thresholds explained
- Product overview: Org Hierarchy
Your feedback helps us improve the Help Center.